Three questions about the rules of food trade, answered with data and with people
Trade brings consumers choice and farmers markets. It also carries risk: contaminated food, invasive pests, crop disease. The World Trade Organization lets countries block imports to manage that risk, but only if the measures are genuine. This thesis tested whether they are, who wins when countries disagree, and how the people at the start of the supply chain actually behave under risk.
The journey
Tap a stop.
Inside the thesis
The PhD thesis has eight chapters. The two master's degrees came before it and have their own tab, Before the PhD.
Import risks: the rules countries set at the border, then the pests that get past itRead the thesis ↗ 2Environmental protection or protectionism?
Do countries put up health rules when their tariffs fall?Trade rules → 3Patterns of trade concerns in SPS and TBT use
Which rules get challenged in Geneva, and by whomDisputes → 4Dispute resolution and plant health cases
Developing countries struggle to win against rich onesDisputes → 5A case study of responses to SPS issues: Uganda's coffee
Cooperatives, certification and fair prices along the chainUganda → 6Risk aversion of coffee farmers and traders
The marble game and the coffee market gamePlay → 7Income diversification and decision-making
Why farmers prune, spray, switch crops or walk away from coffeeUganda → 8Conclusion and future work
Where SPS and TBT rules are heading, and early work on risks at the EU borderRead the thesis ↗
"We need tools to better discern effective and just environmental measures from those with purely import excluding intent."Lee Pearson, EPA Marshall Scholarship biography
Before the PhD: two master's degrees on water, land and carbon
A Marshall Scholarship brought Lee from Duke civil and environmental engineering to the UK for two master's degrees. Both were optimisation problems: how to meet the same needs with less water, land and carbon. The first already asked the question the PhD would chase: what does trade in food do to the resources and people behind it? Each has its own page.
 MSc Ecological Economics · University of Edinburgh · 2009
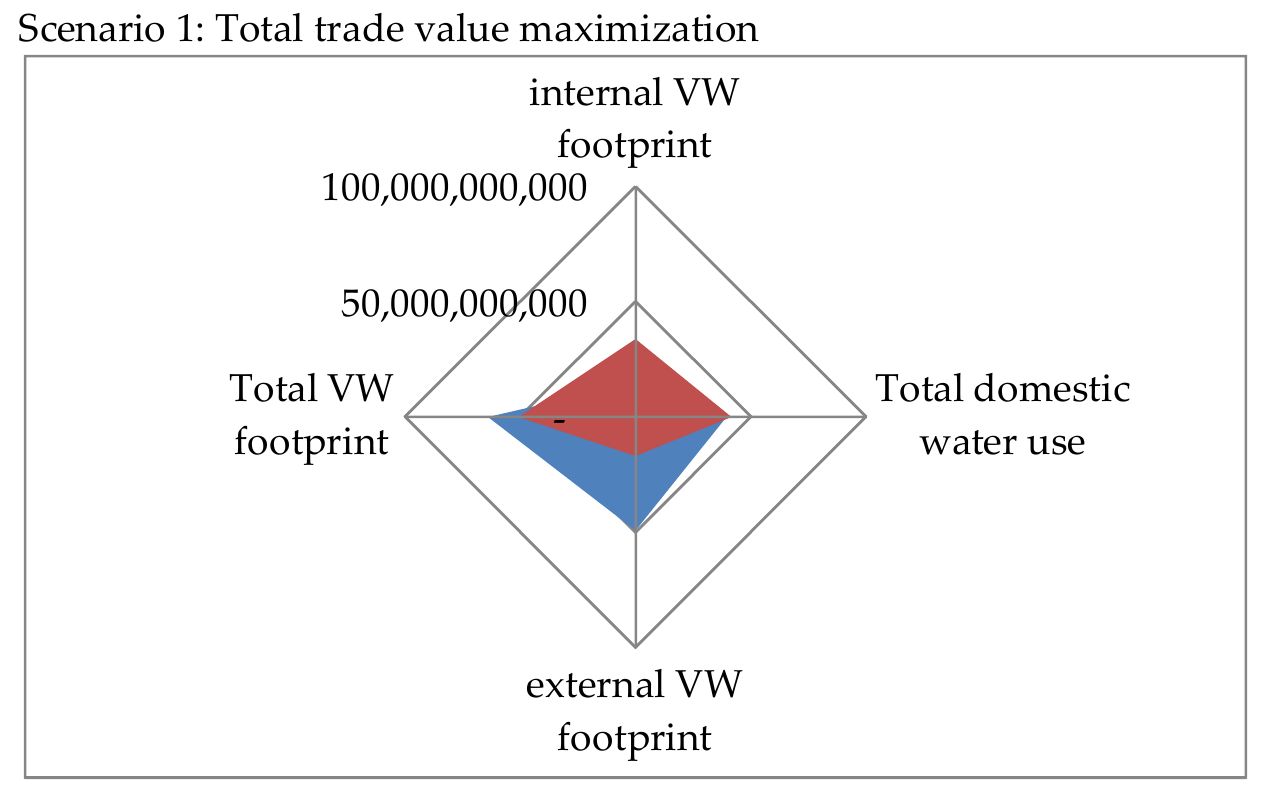
Optimising water and land in Germany's crop trade
A linear programme of 47 primary crops that found what Germany should grow, import and export to earn the most from trade, or to use the least water or the least land, and showed that the three goals pull in very different directions.
The best trade balance (blue) against what Germany actually did (red): water used at home and abroad. Dissertation Figure 24, 2009.
 MPhil Engineering for Sustainable Development · Jesus College, Cambridge · 2010
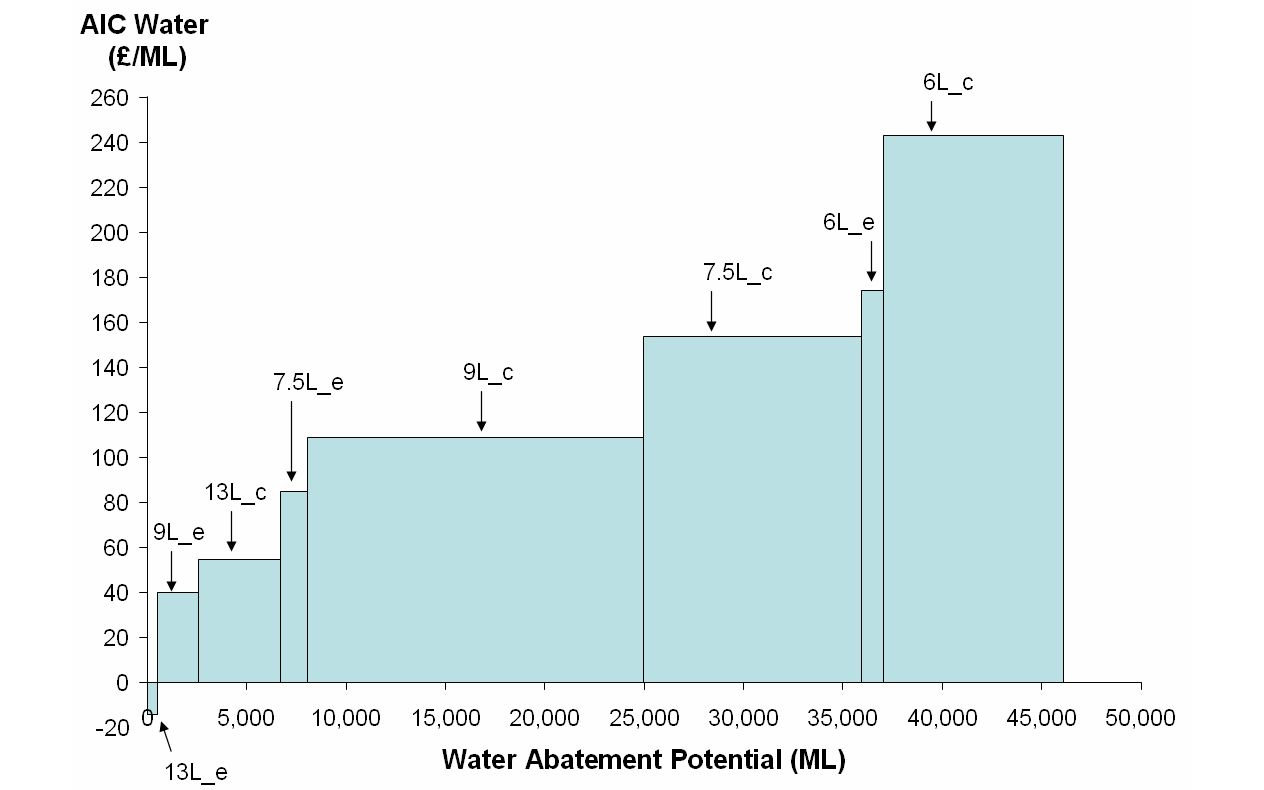
Cutting water, energy and carbon in Scottish homes
With the Water Industry Commission for Scotland: which home efficiency programmes save the most water, the energy to heat it and the carbon that rides along, and how stacking water, energy and carbon credits could pay for them.
The cost per megalitre of water saved by replacing or retrofitting every toilet in Scotland, cheapest first. Dissertation Figure 26, 2010.
Then a term in Washington
Between Cambridge and Imperial, Lee spent twelve weeks, from 30 August to 19 November 2010, as one of 26 new Christine Mirzayan Science and Technology Policy Fellows at the National Academies in Washington DC. He was placed in the National Academy of Engineering's Program Office, with its director, Proctor Reid, as his mentor, and left for London to start the PhD in late December.
 Mirzayan Fellowship · National Academy of Engineering · autumn 2010
Helping to start a roundtable on science, technology and peace
The National Academies, led by the NAE, and the US Institute of Peace were setting up the Roundtable on Science, Technology and Peacebuilding, which their proposal called "first-ever": a forum where government, industry, universities and NGOs would ask how engineering and science can help prevent conflict, make peace and keep it. Its first topics were natural resource scarcity, data and information management, education and training, and science, engineering and health diplomacy.
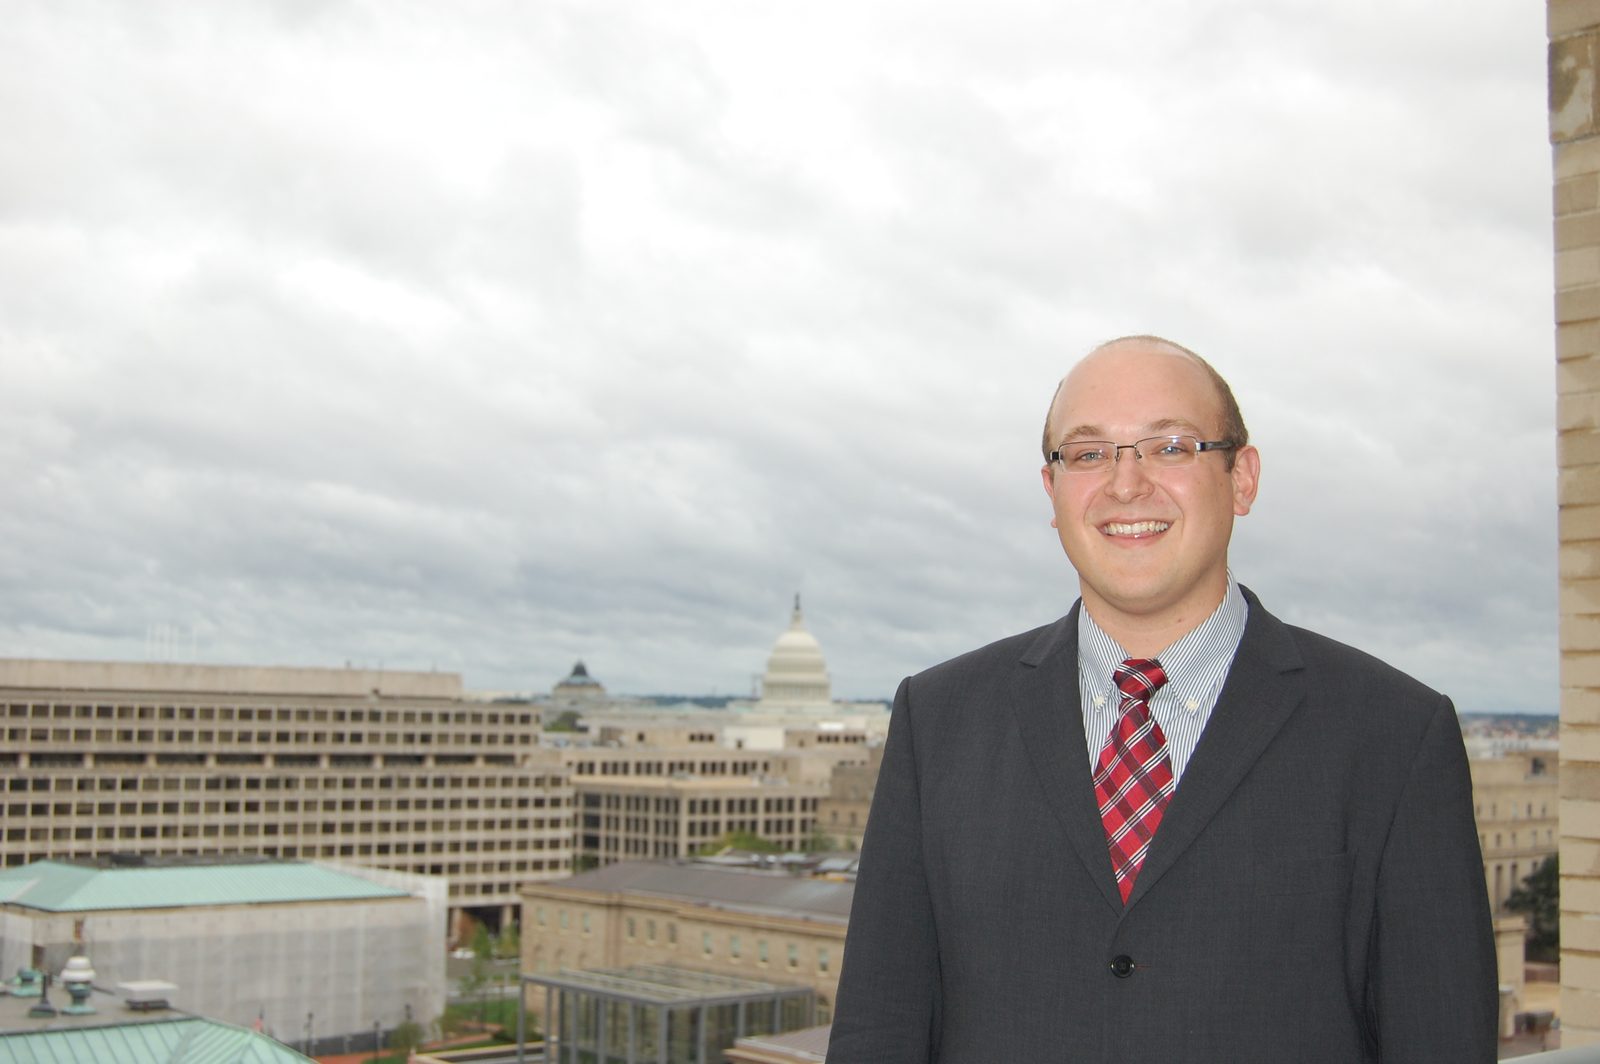
Lee's official photo as a Mirzayan Fellow, the Capitol behind him, 30 September 2010.
Members, measures and a policy brief
- Profiled 15 multinational firms as possible members, from GE and Google to Coca-Cola and Microsoft, linking each company's business and social responsibility work to a possible role in peacebuilding
- At the NAE Annual Meeting on 3 and 4 October 2010, recruited Bernard Amadei, founder of Engineers Without Borders-USA, to join the roundtable
- Reviewed how peacebuilding is measured, from the Global Peace Index and the Failed States Index to the US government's own frameworks, toward a concept paper on metrics for the roundtable
- Wrote the fellowship's individual policy brief, "Role of User-Generated Content (UGC) in Peacebuilding", dated 21 October 2010 and addressed to Alec Ross, the State Department's Senior Advisor for Innovation
"The fellowship in DC was a formative experience and piqued my interest in the public sector and the impact of policy on society."Lee Pearson, report to the Marshall Commission, August 2011
Sources: the Fall 2010 Mirzayan agenda, activities calendar and mentor guidelines (26 new fellows); the National Academies and US Institute of Peace roundtable proposal, March 2010; Lee's weekly log, goal-setting notes, firm profiles, metrics review and policy brief from the fellowship; his CV of January 2013; his report to the Marshall Commission, August 2011. Photo: Lee's official fellowship photo, 30 September 2010.
Protection or protectionism?
As WTO members cut tariffs, an old worry grew: would governments quietly replace tariffs with health and safety rules that keep foreign food out? This chapter put that to the test across the food-safety and plant/animal health (SPS) and product-standard (TBT) notifications from 1996 to 2010 that named a product, matched to tariffs, trade, governance and environmental data: 98 countries and 69 product groups for SPS, and 68 countries and 95 product groups for TBT.
Thesis Tables 1 to 4, 1996 to 2010. Source data: WTO SPS and TBT Information Management Systems.
The Philippines filed 14% of the emergency SPS notices in the data
Of the 2,559 emergency food-safety and animal or plant health notices in the data, 362 came from the Philippines, more than any country except Albania. Emergency notices are meant to be temporary responses to sudden risks, such as disease outbreaks in exporting countries.
Falling tariffs do bring more health rules, but they are not the main driver
Across a range of increasingly cautious models, products whose bound tariffs fell were more likely to see new SPS measures, driven mostly by developed, founding WTO members. But democracy, regulatory quality, environmental governance and ageing populations were larger and more important drivers, which points to genuine protection.
Test your intuition
When a country cries foul
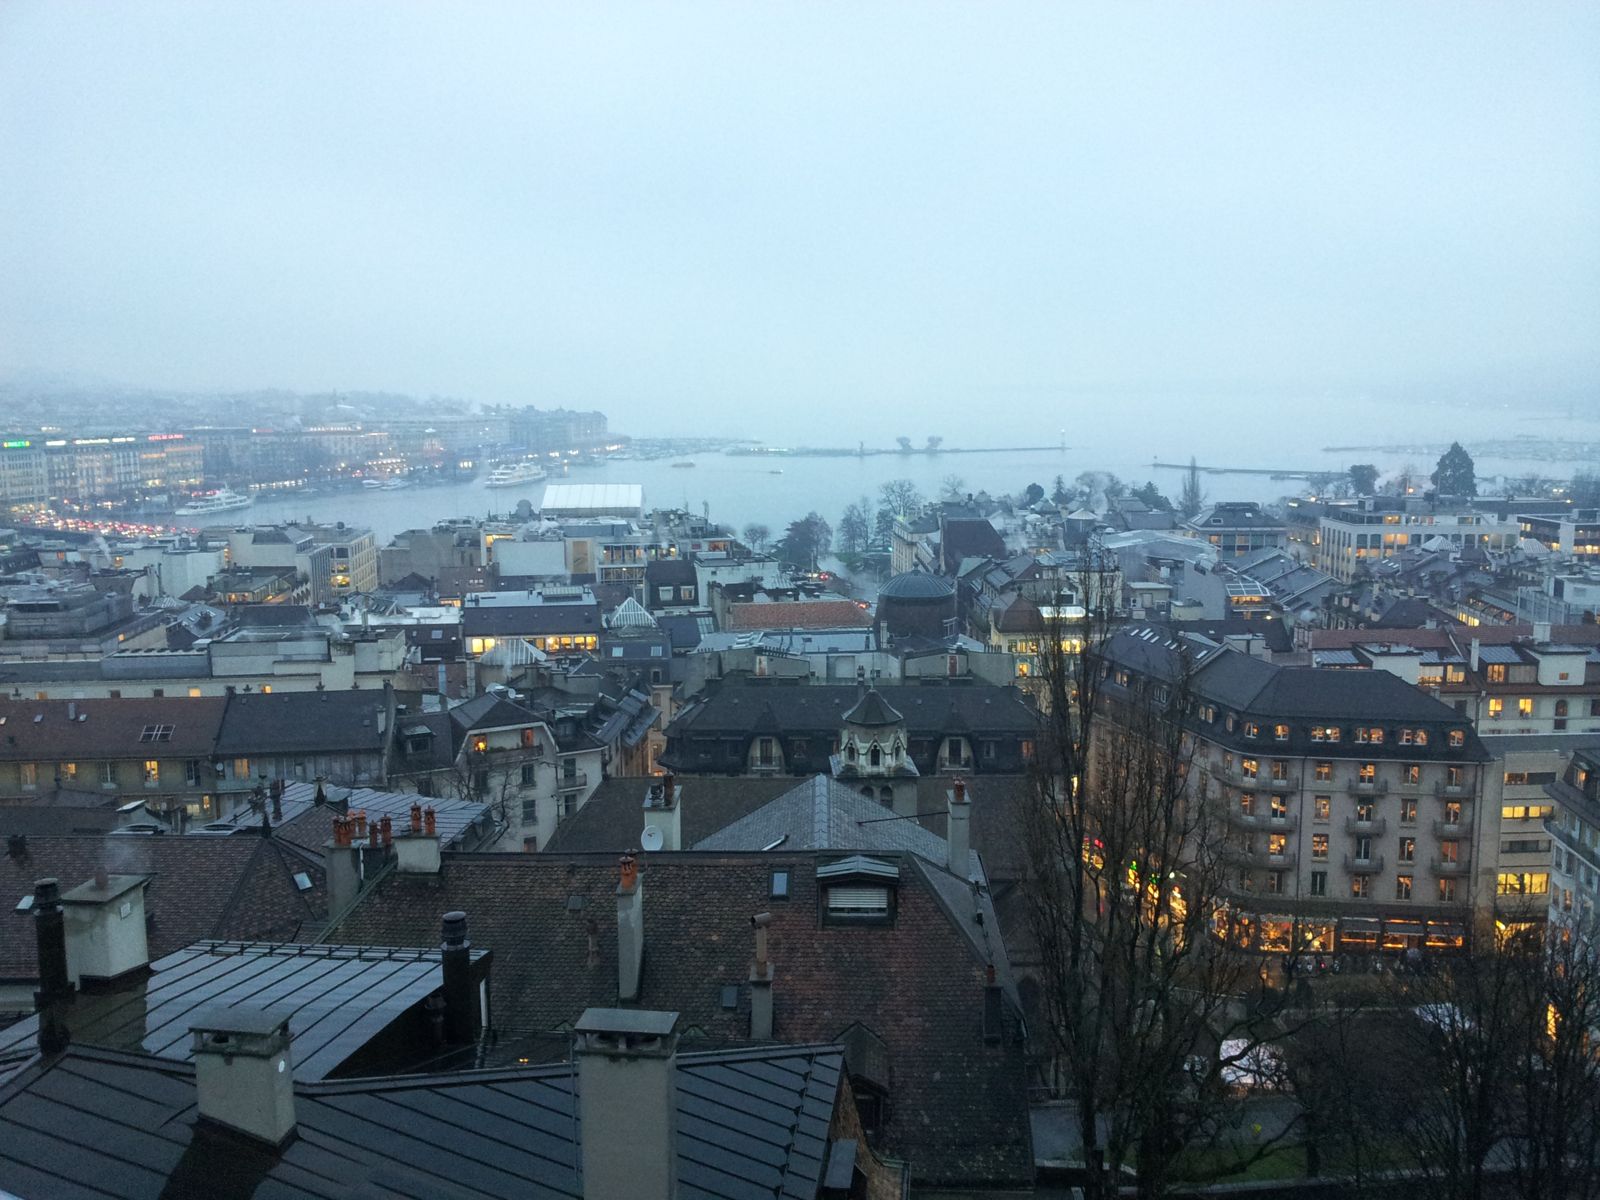
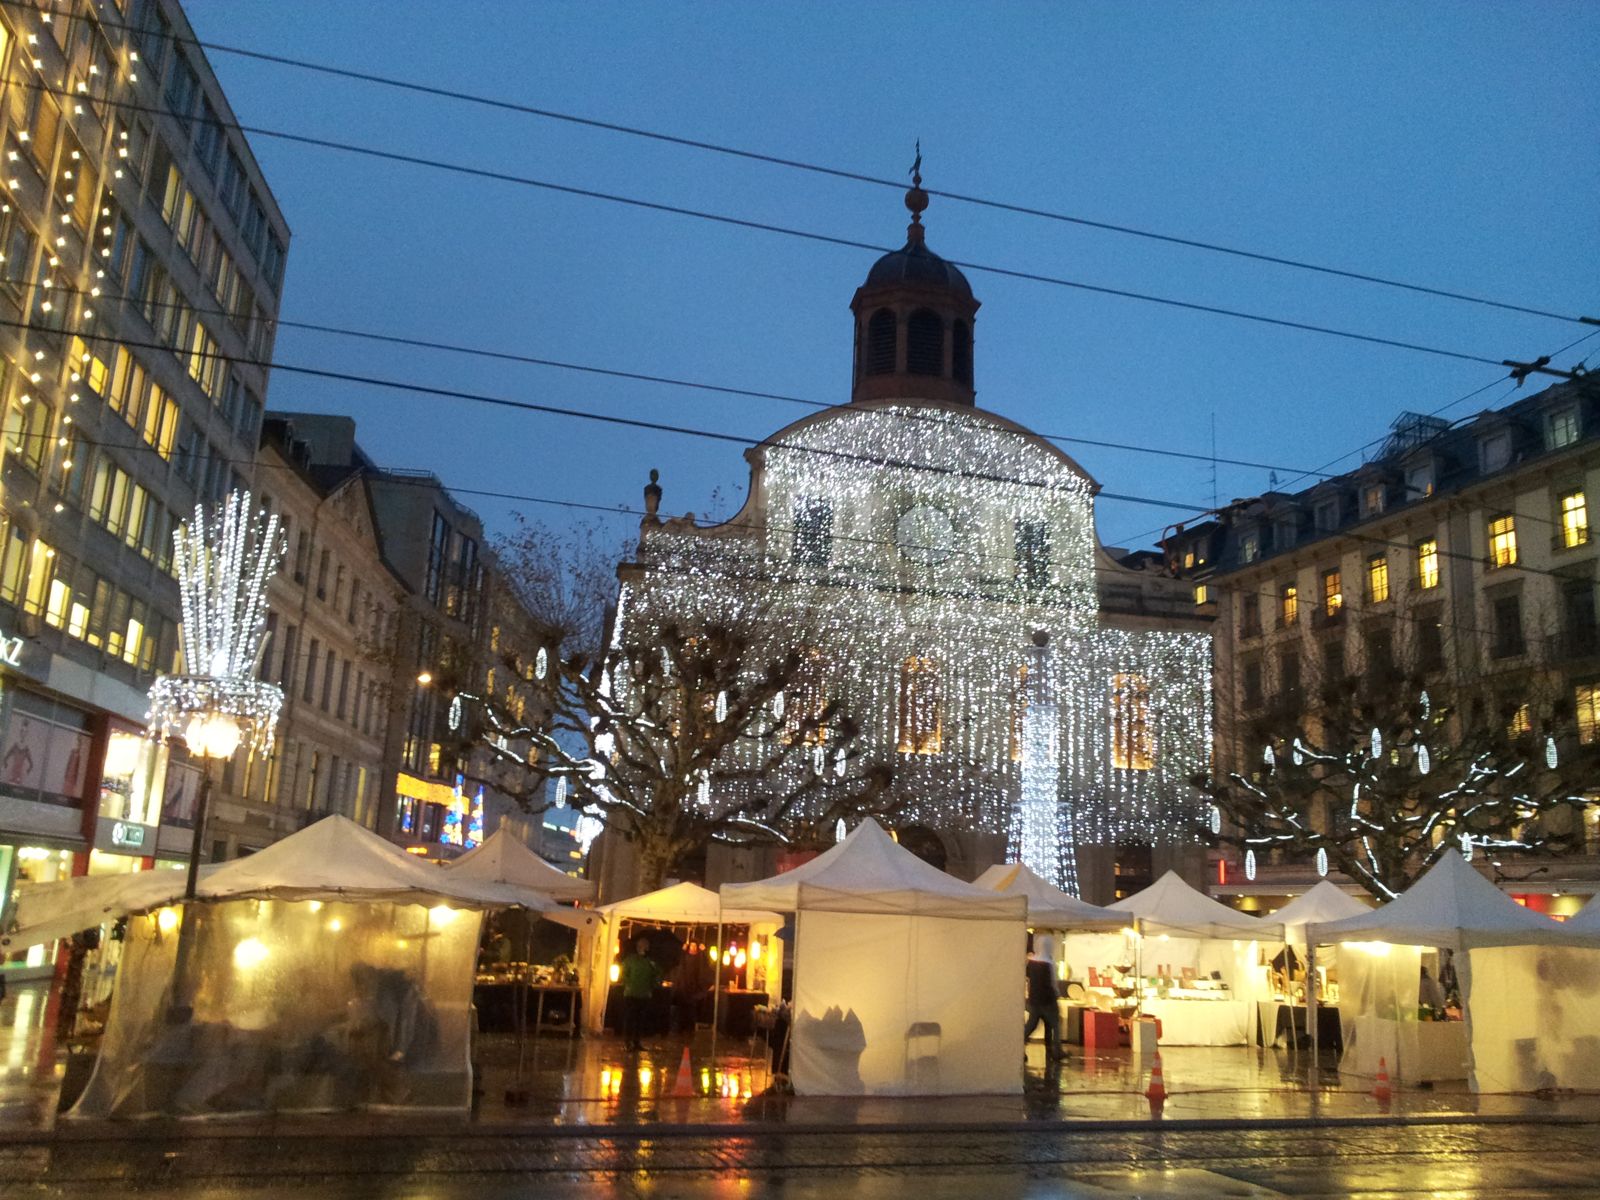
Three times a year, WTO members meet in Geneva and can raise a "specific trade concern" against another member's food safety or plant health rule. It is the first formal step before a full dispute. Lee coded every one of the 292 concerns raised from 1996 to 2010, traced which were resolved, and on 20 December 2012 took the results to Geneva to discuss them with Gretchen Stanton and her colleagues in the WTO's SPS Secretariat.

Thesis Table 19 and Appendix A.8. Counts are unique concerns, not re-raisings.
Who raises concerns, and who gets challenged
The US and EU top both lists. What separates the rest is farm trade: big net food exporters like Argentina, Canada and Thailand raise far more concerns than they face, while big net food importers like Japan and Korea face many and raise none.
Thesis Tables 69 and 70 (Appendices A.8 and A.9), SPS concerns first raised 1996 to 2010, resolution status to 2012. Names in gold are net food exporters and names in blue net food importers in 2011 (Appendix A.11), where the thesis discusses them. Concerns raised jointly as "certain members" are left out.
Who wins a dispute? Play the odds
Pick who raises the concern and who maintains the rule, then how many times the concern is brought back to the committee. The bars use a log scale. The thesis found that the gap in economic power, and persistence, decided how likely a concern was to be resolved.
Raising member
Member maintaining the rule
Odds of resolution relative to a concern between two developed members that is raised once, from the logit model in thesis Table 31, column 3 (242 concerns, product dummies included): raising member developing, coefficient −0.828; maintaining member developing, +0.775; each extra raise, +0.269. The line marks even odds with that baseline.
79 plant health cases, read one by one
Thesis Table 34. Share of the 108 country and product observations behind the 79 plant health concerns of 1996 to 2010; a concern can cite more than one reason.
Economics is the usual complaint, science the slow one
86% of plant health complaints argued that a rule was too slow or too trade restrictive, and 44% challenged the science or the pest-free status behind it. The type of complaint did not change whether a concern was resolved, but science-based concerns took about two years longer to settle. East Asian members mostly faced challenges to their science; North America, mainly the US, mostly faced complaints about delays and rules stricter than needed.
Thesis Tables 34 and 35, Figures 24 and 26.
What the concerns reveal
No systematic cheating
Declining tariffs made new SPS rules more likely, but did not make those rules more likely to be challenged. Governments seem to work on sensitive products, while staying within the risk-based rules.
Concerns pile up
In every year but 2004, more new concerns were raised than old ones resolved, so the stock of open cases kept growing. Being raised again and again was the most robust predictor of eventual resolution.
Build technical capacity
Developing countries may lack the scientists and lawyers to argue their case against a rich member's regulators. Between two developing members the field is more level.
"Developing countries struggle to resolve concerns they raise against developed economies."Thesis abstract
Coffee, pests and the first mile of the supply chain
Rules at the border only work if risk is managed before export. Uganda's Robusta coffee was the test case: two of its worst pests and diseases arrived across a porous border with the Democratic Republic of Congo, and smallholders carry the cost. Lee went back to Nkokonjeru, where he had worked with the Rural Agency for Sustainable Development (RASD) since 2006, with a UC Davis SEED grant co-written with RASD's Ignitius Bwoogi and Dr. Neil McRoberts.
What the survey covered
In the field
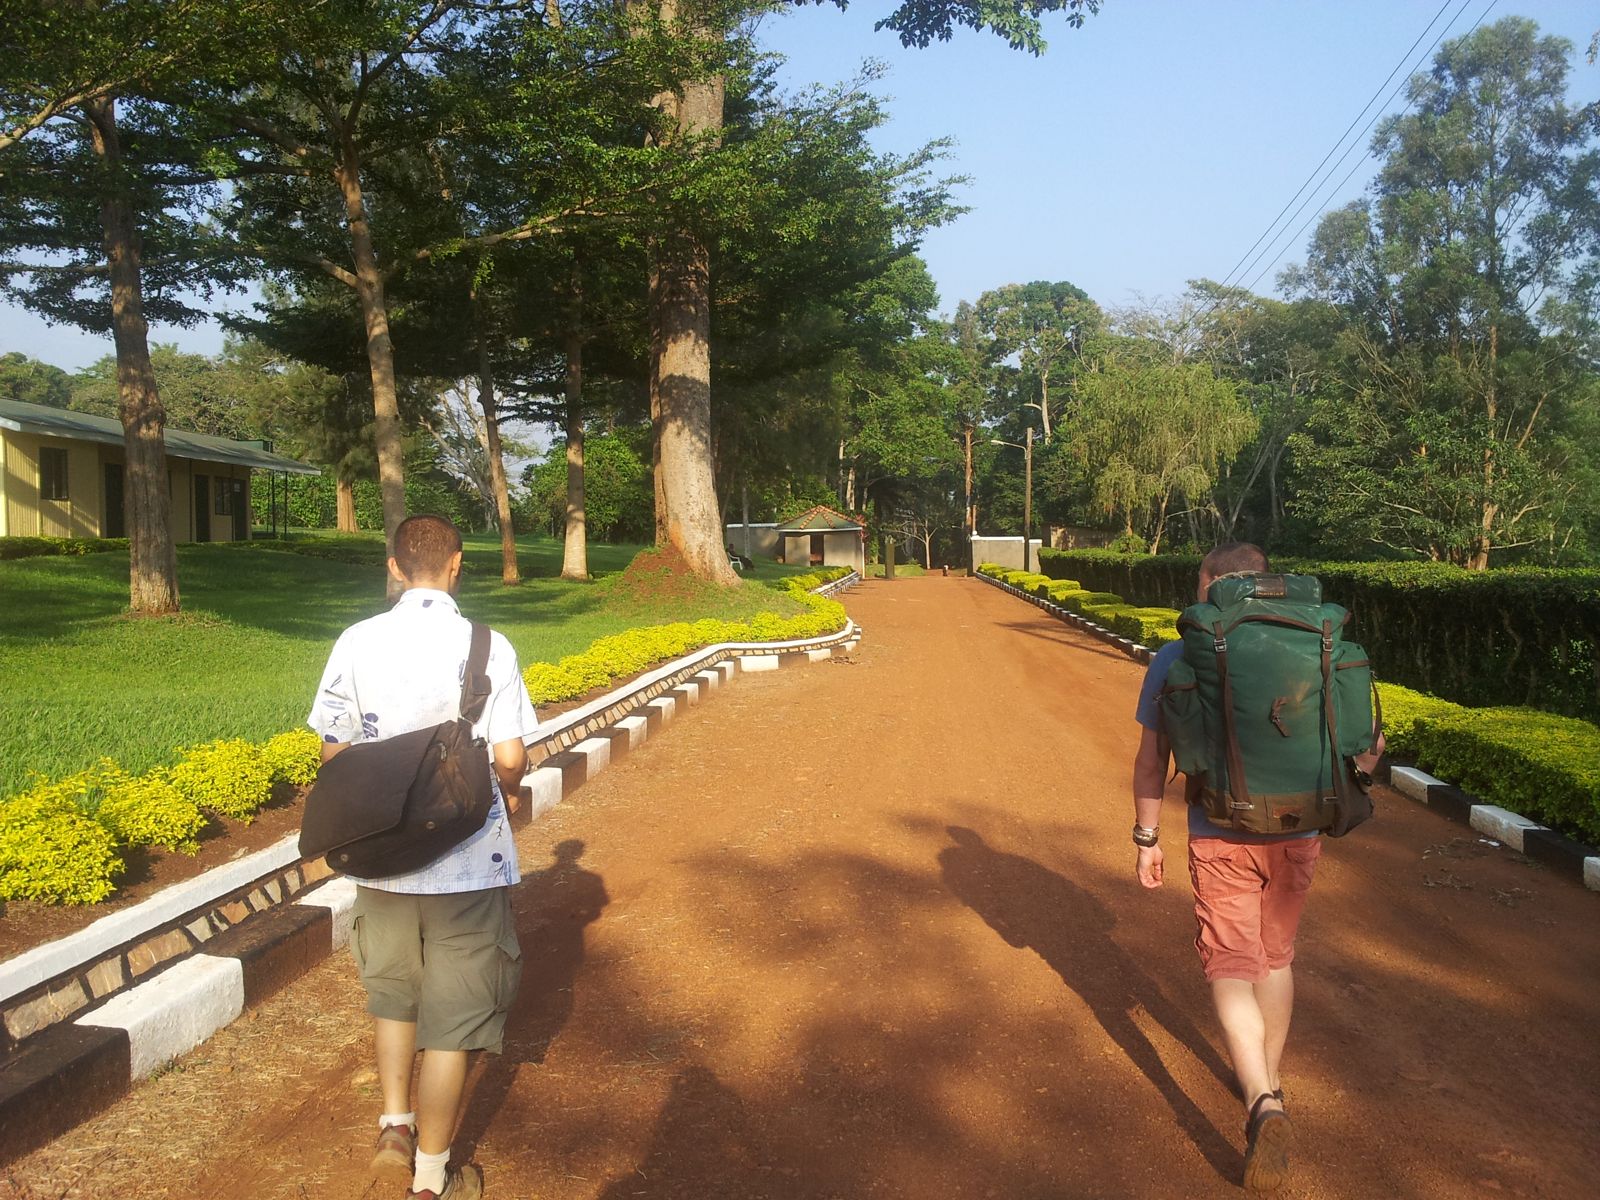
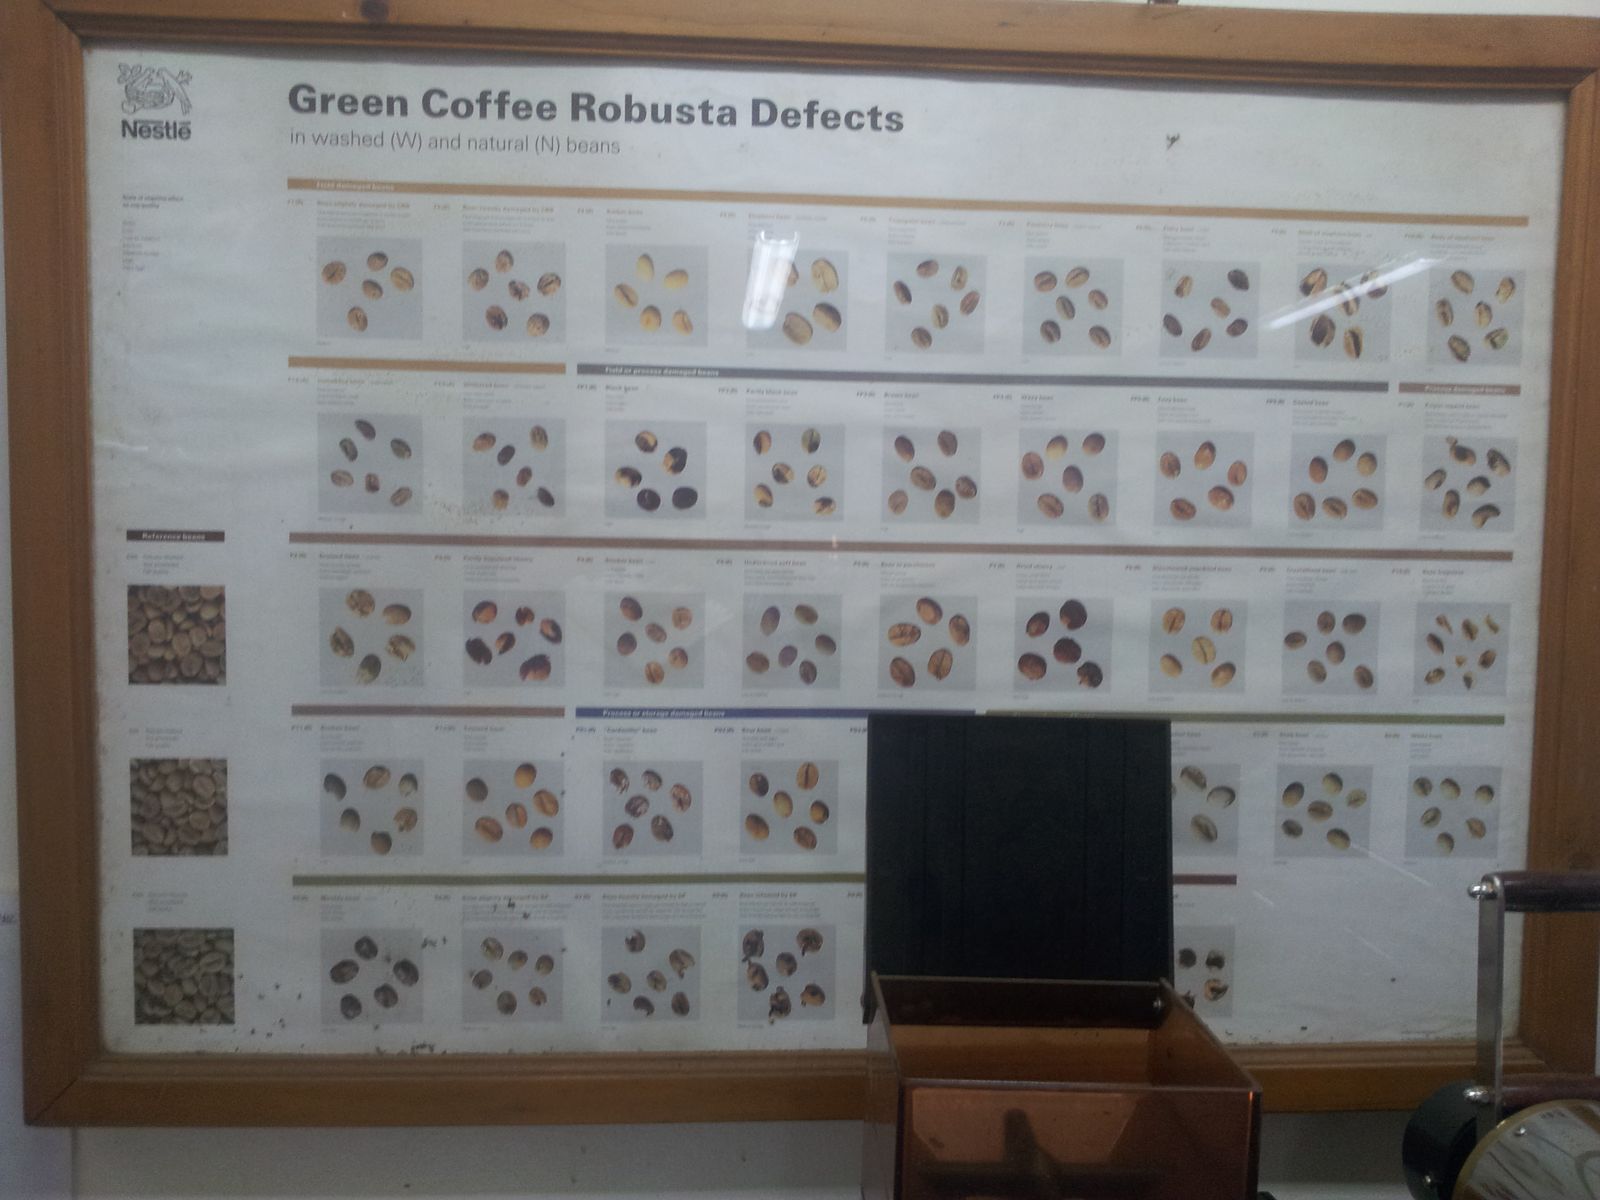
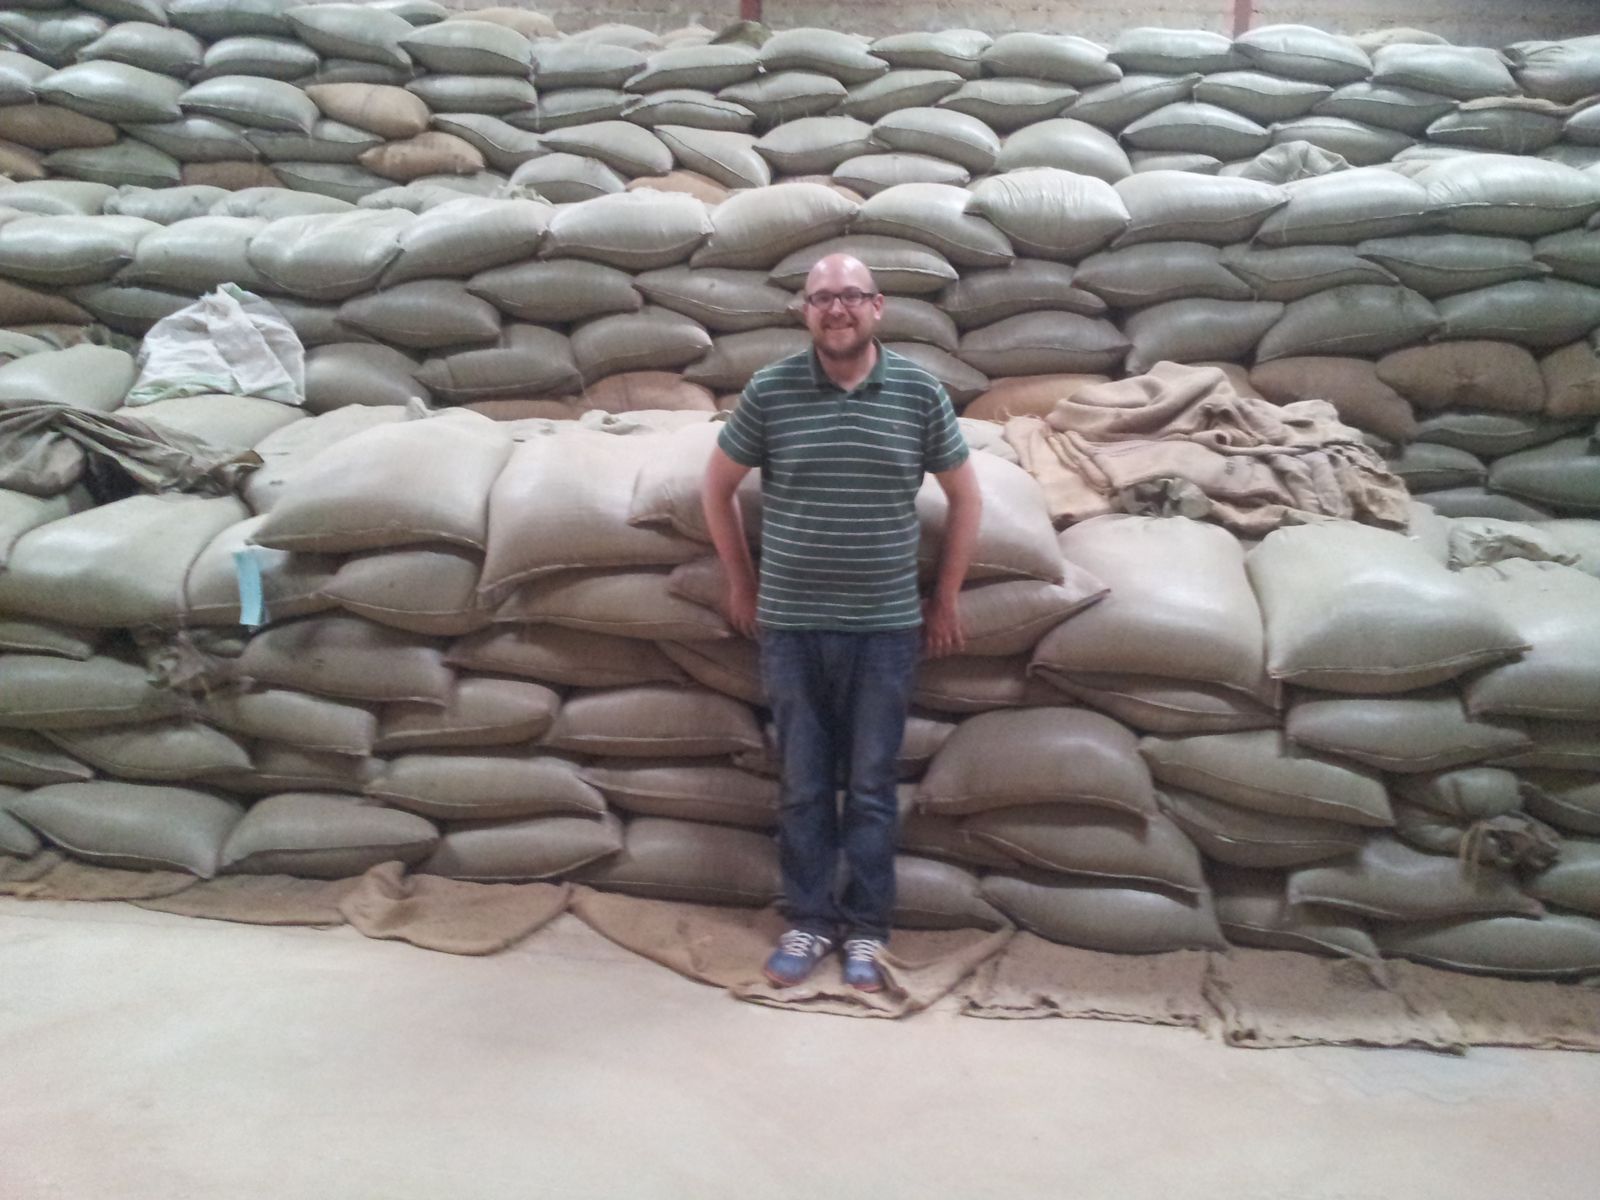
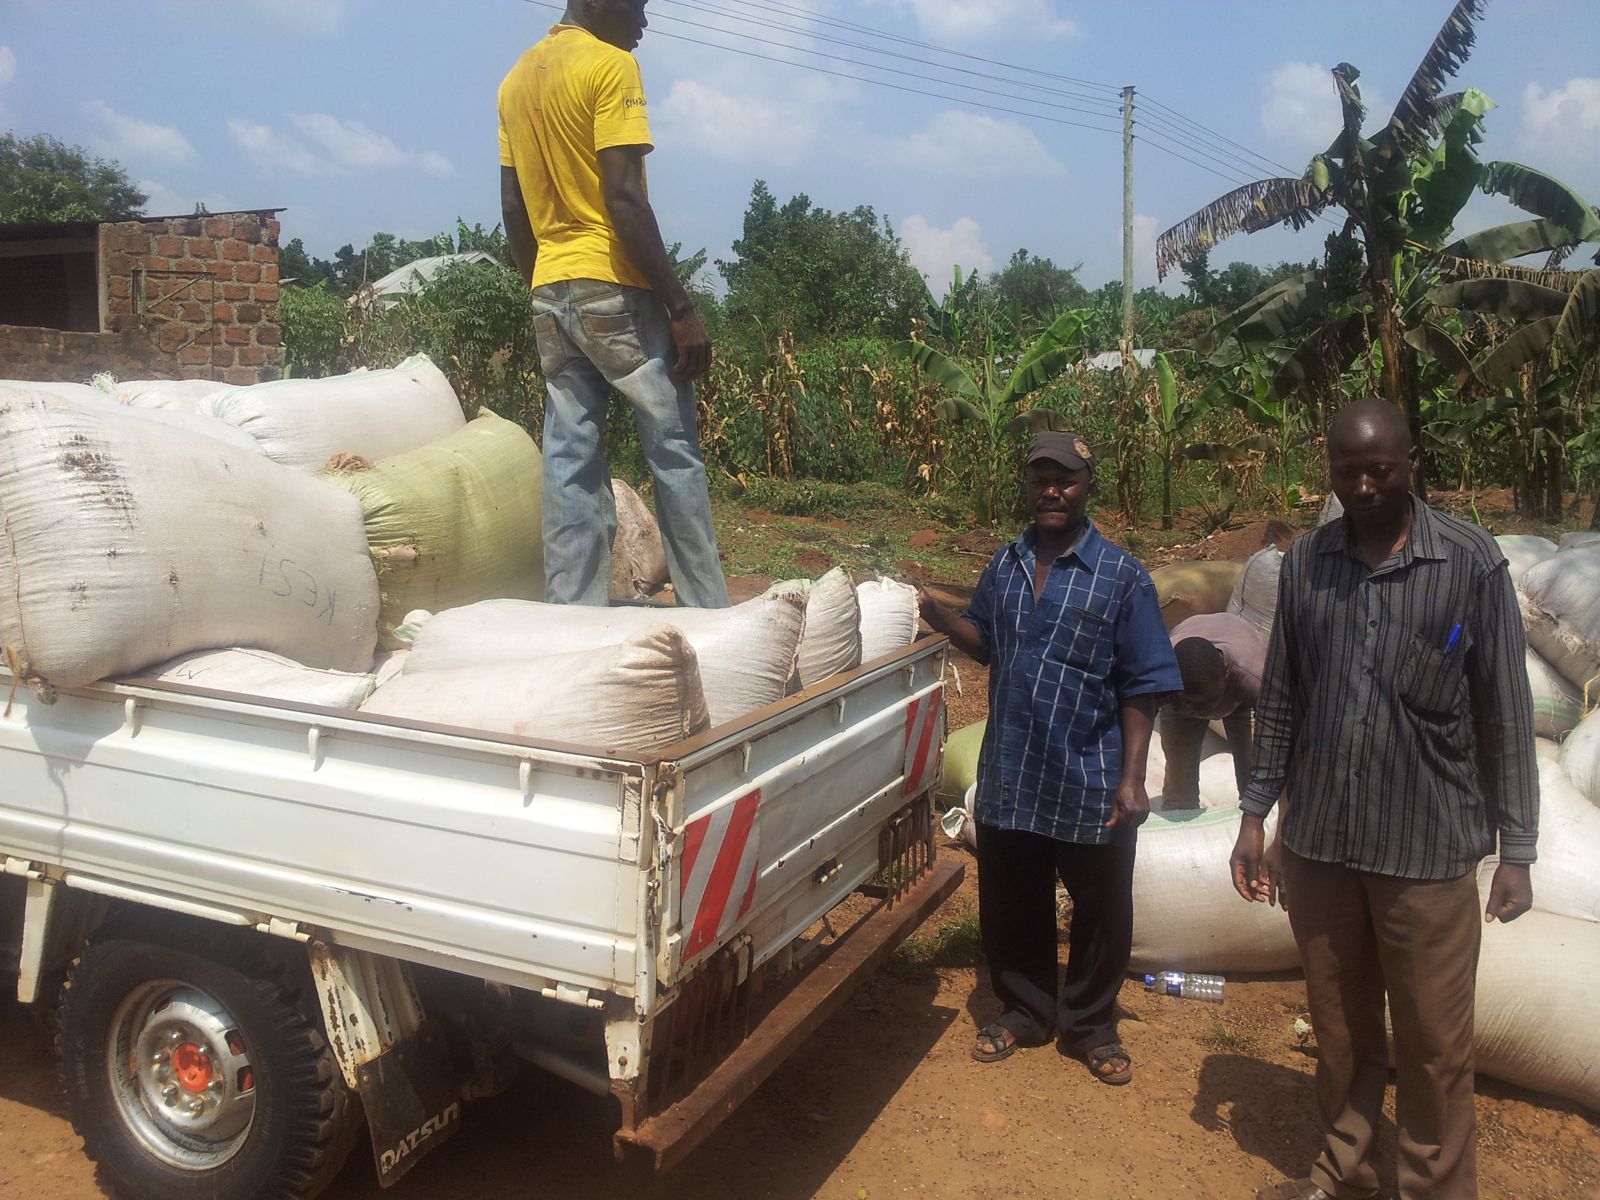
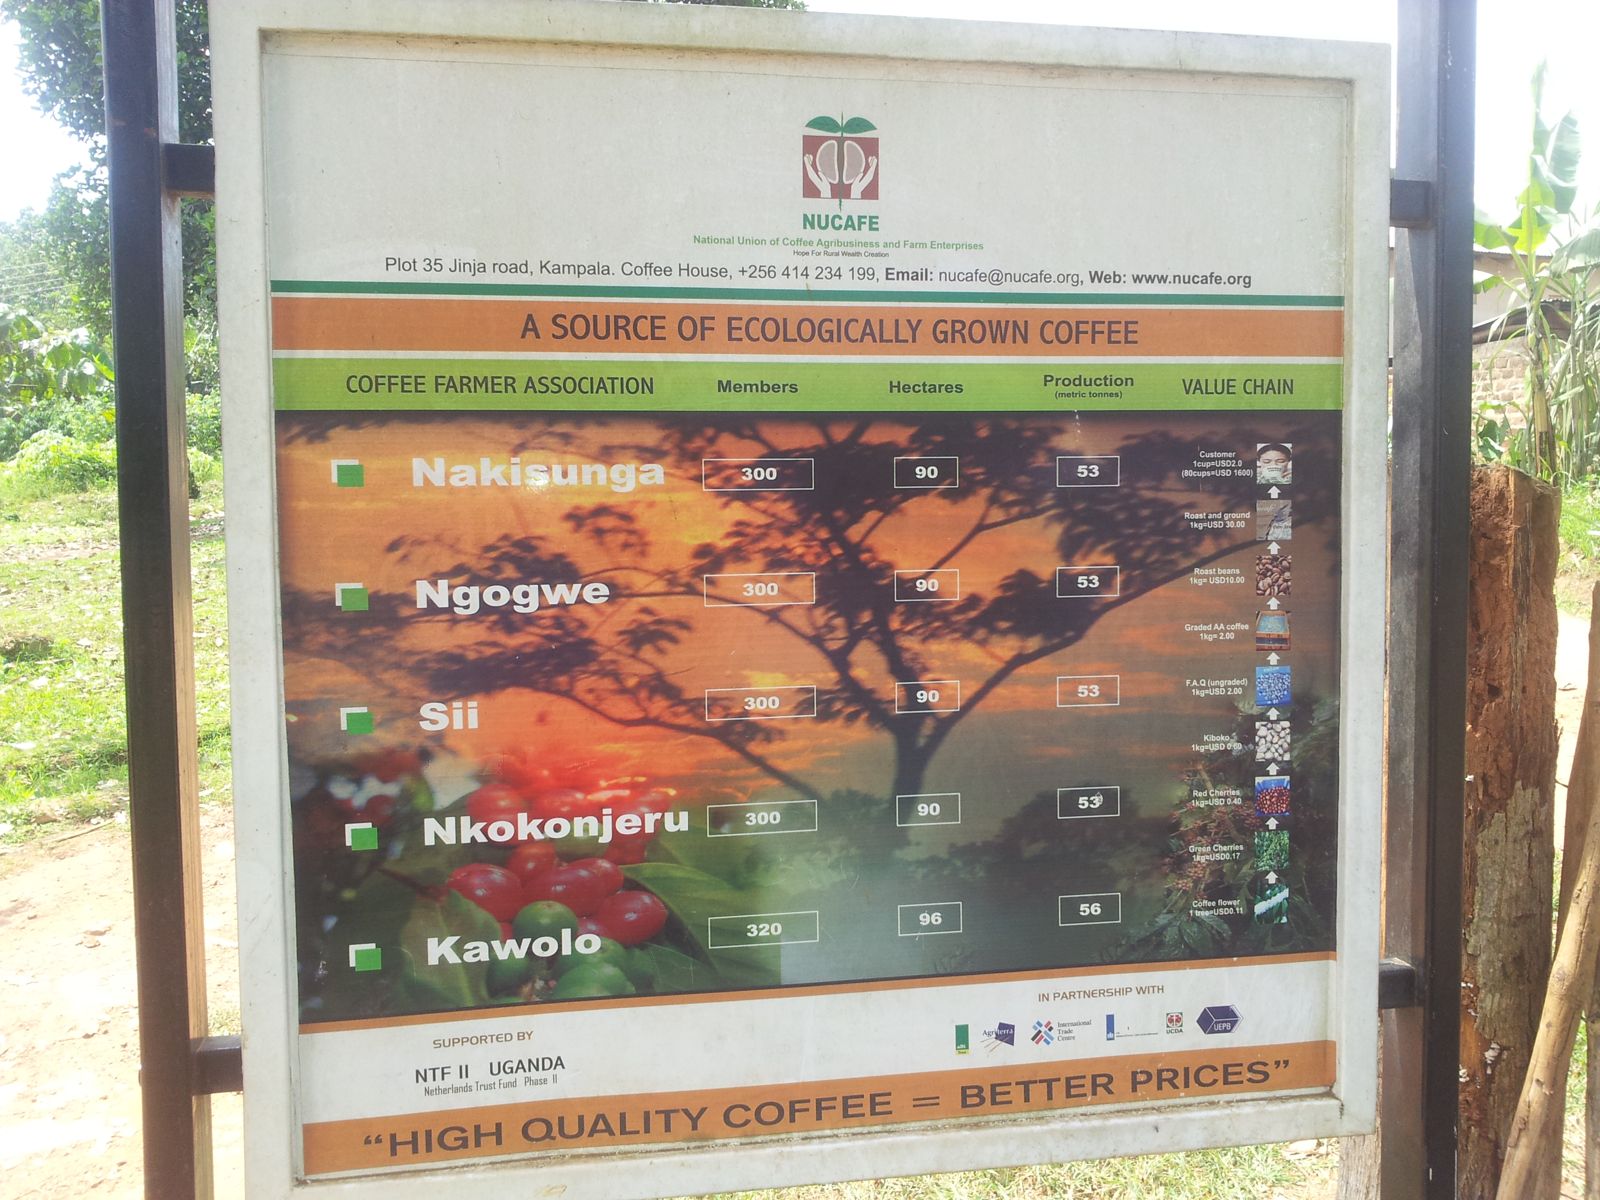
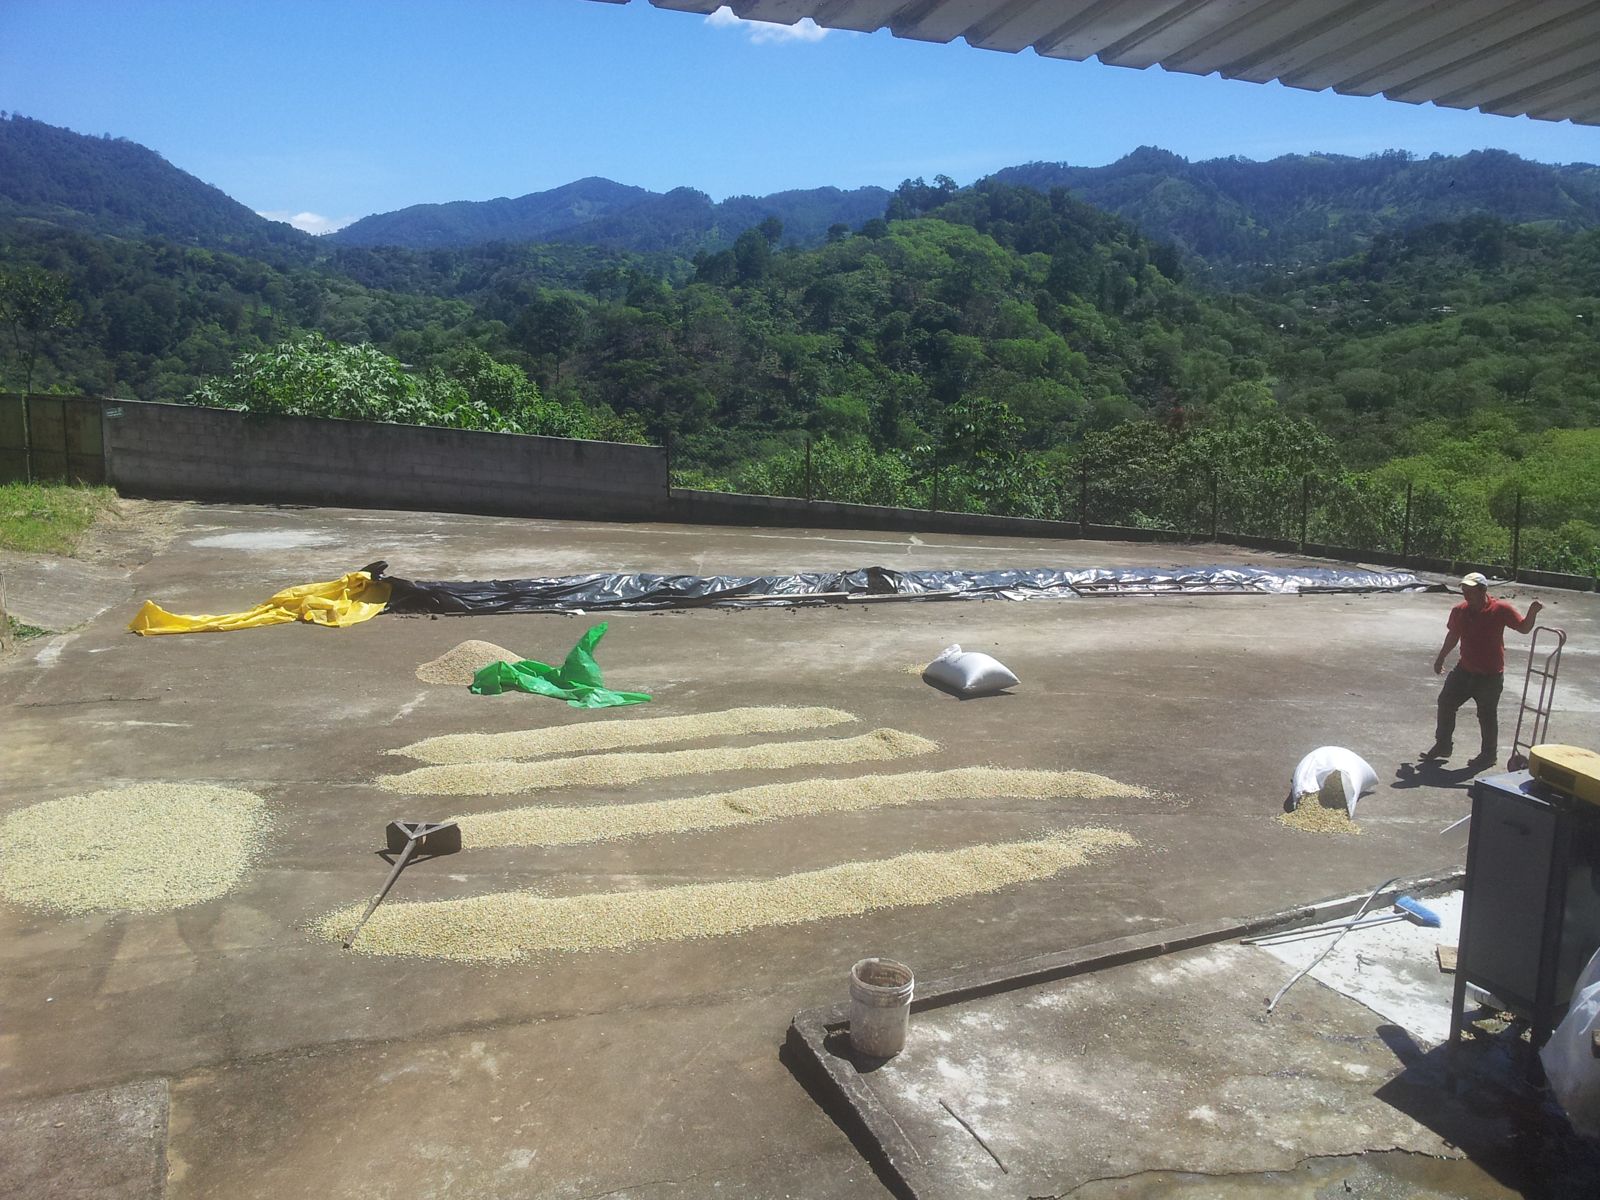
From the UC Davis survey folders, December 2013 to January 2014: research stations, mills, exporters and the pests the team went looking for.
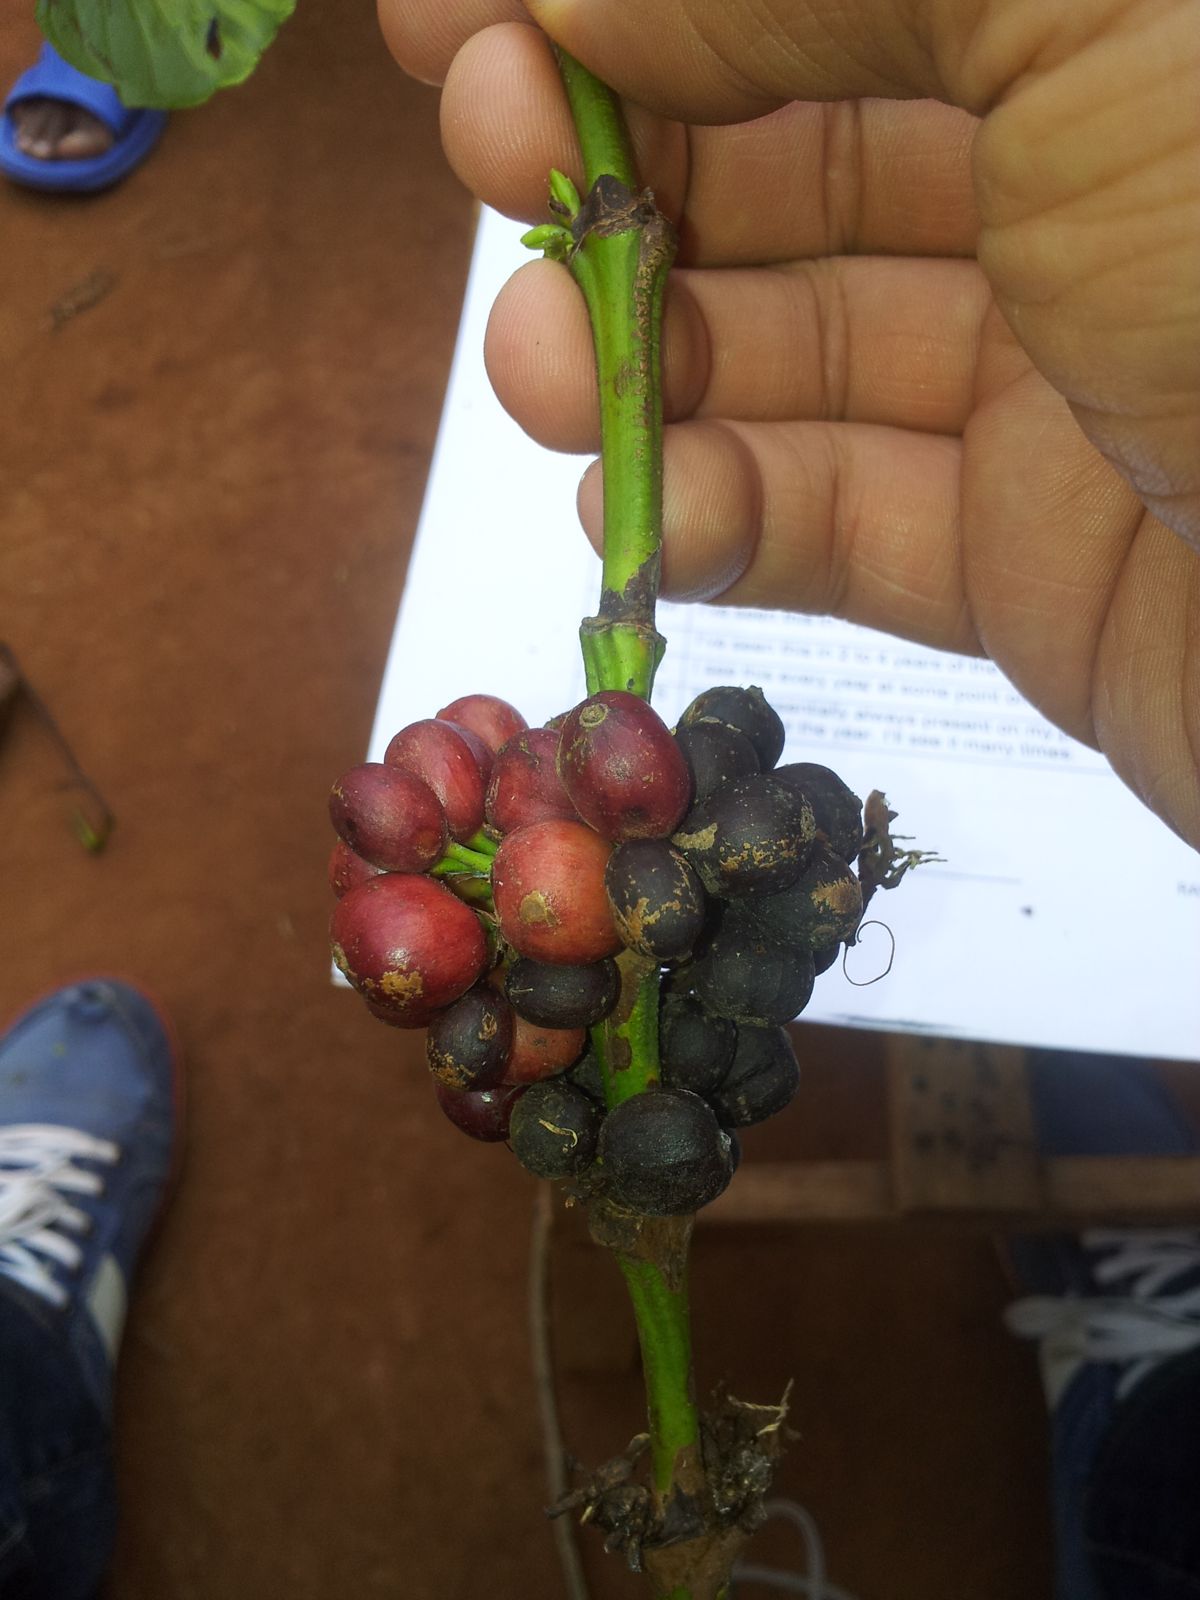
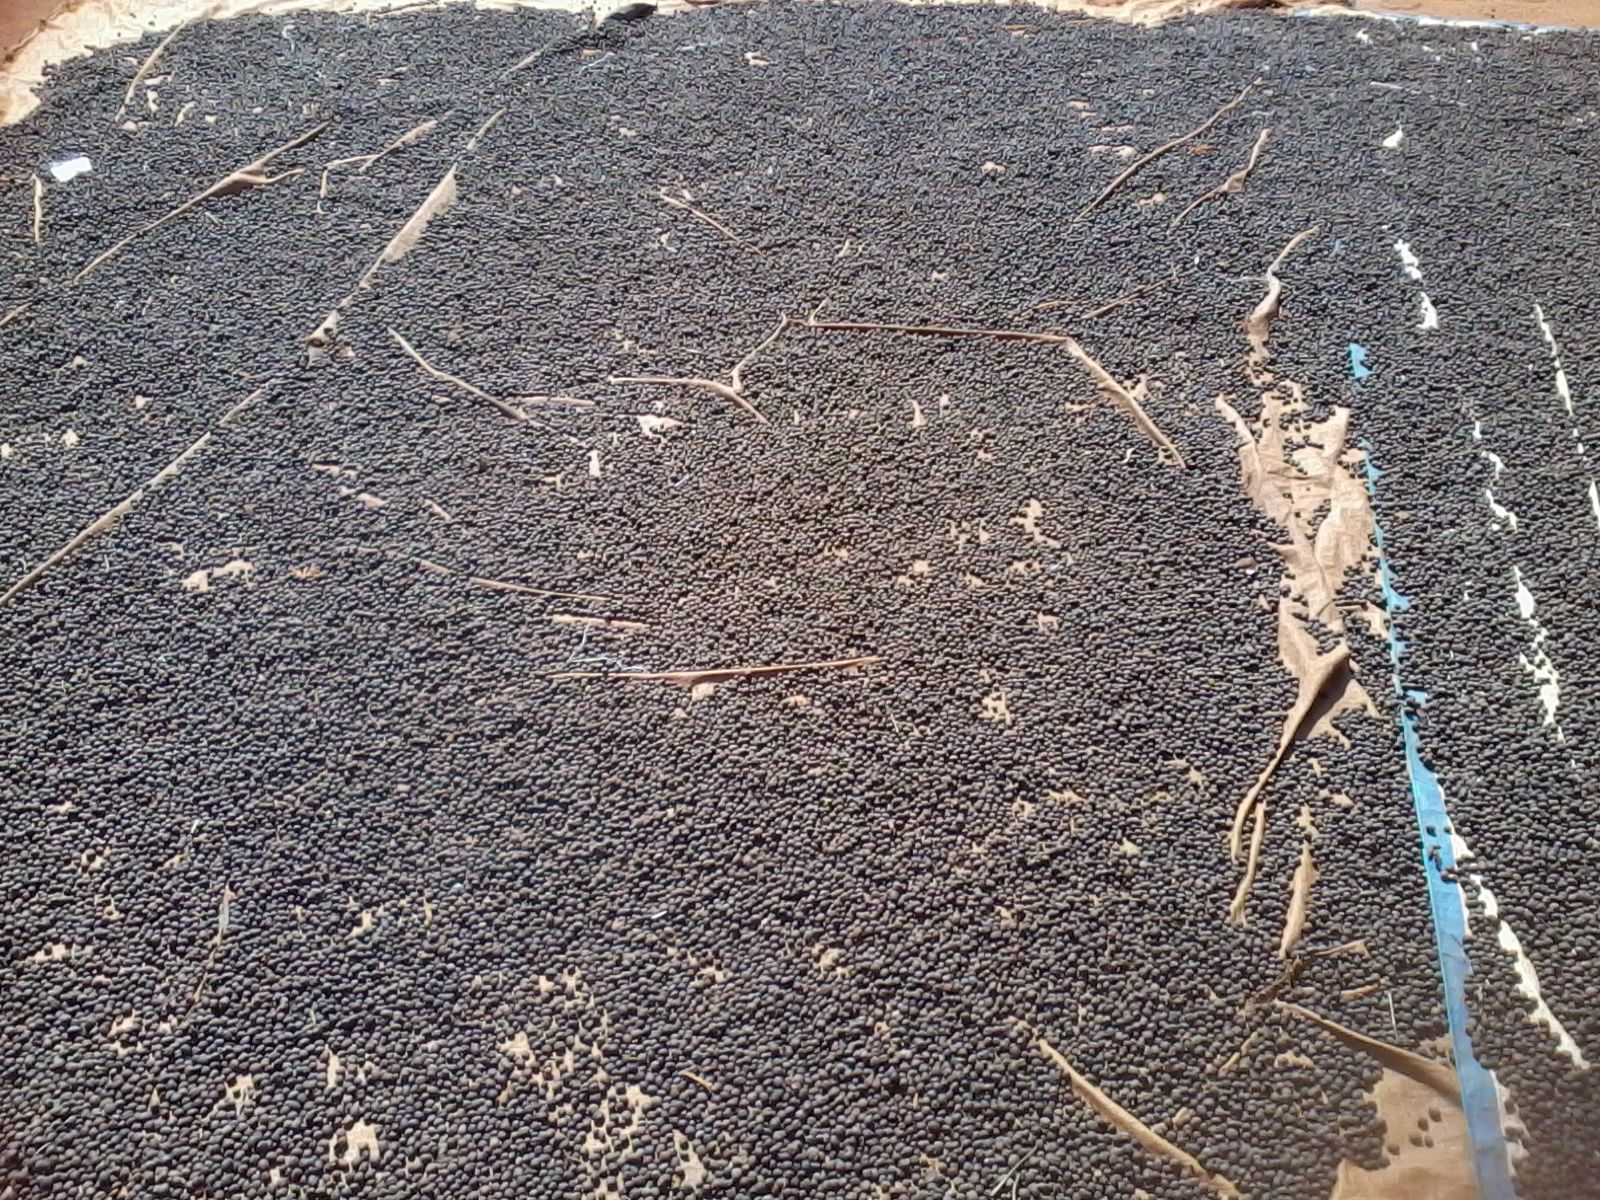
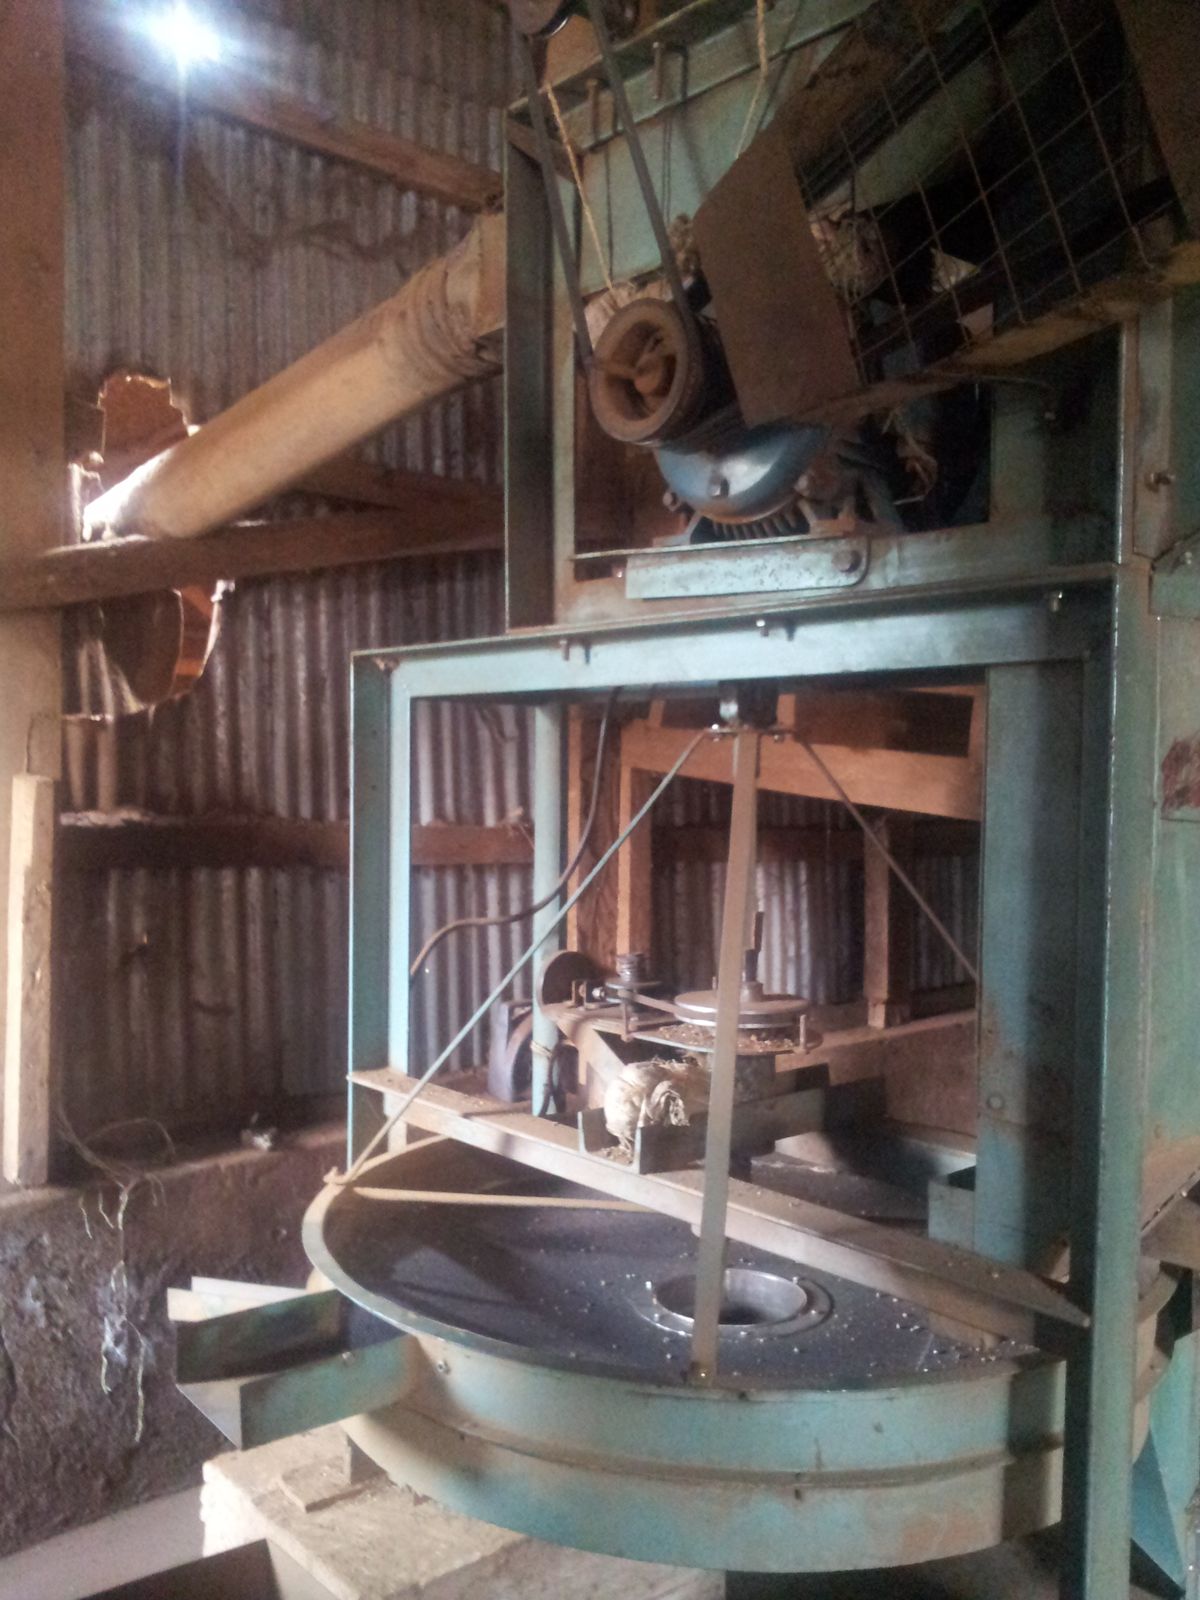
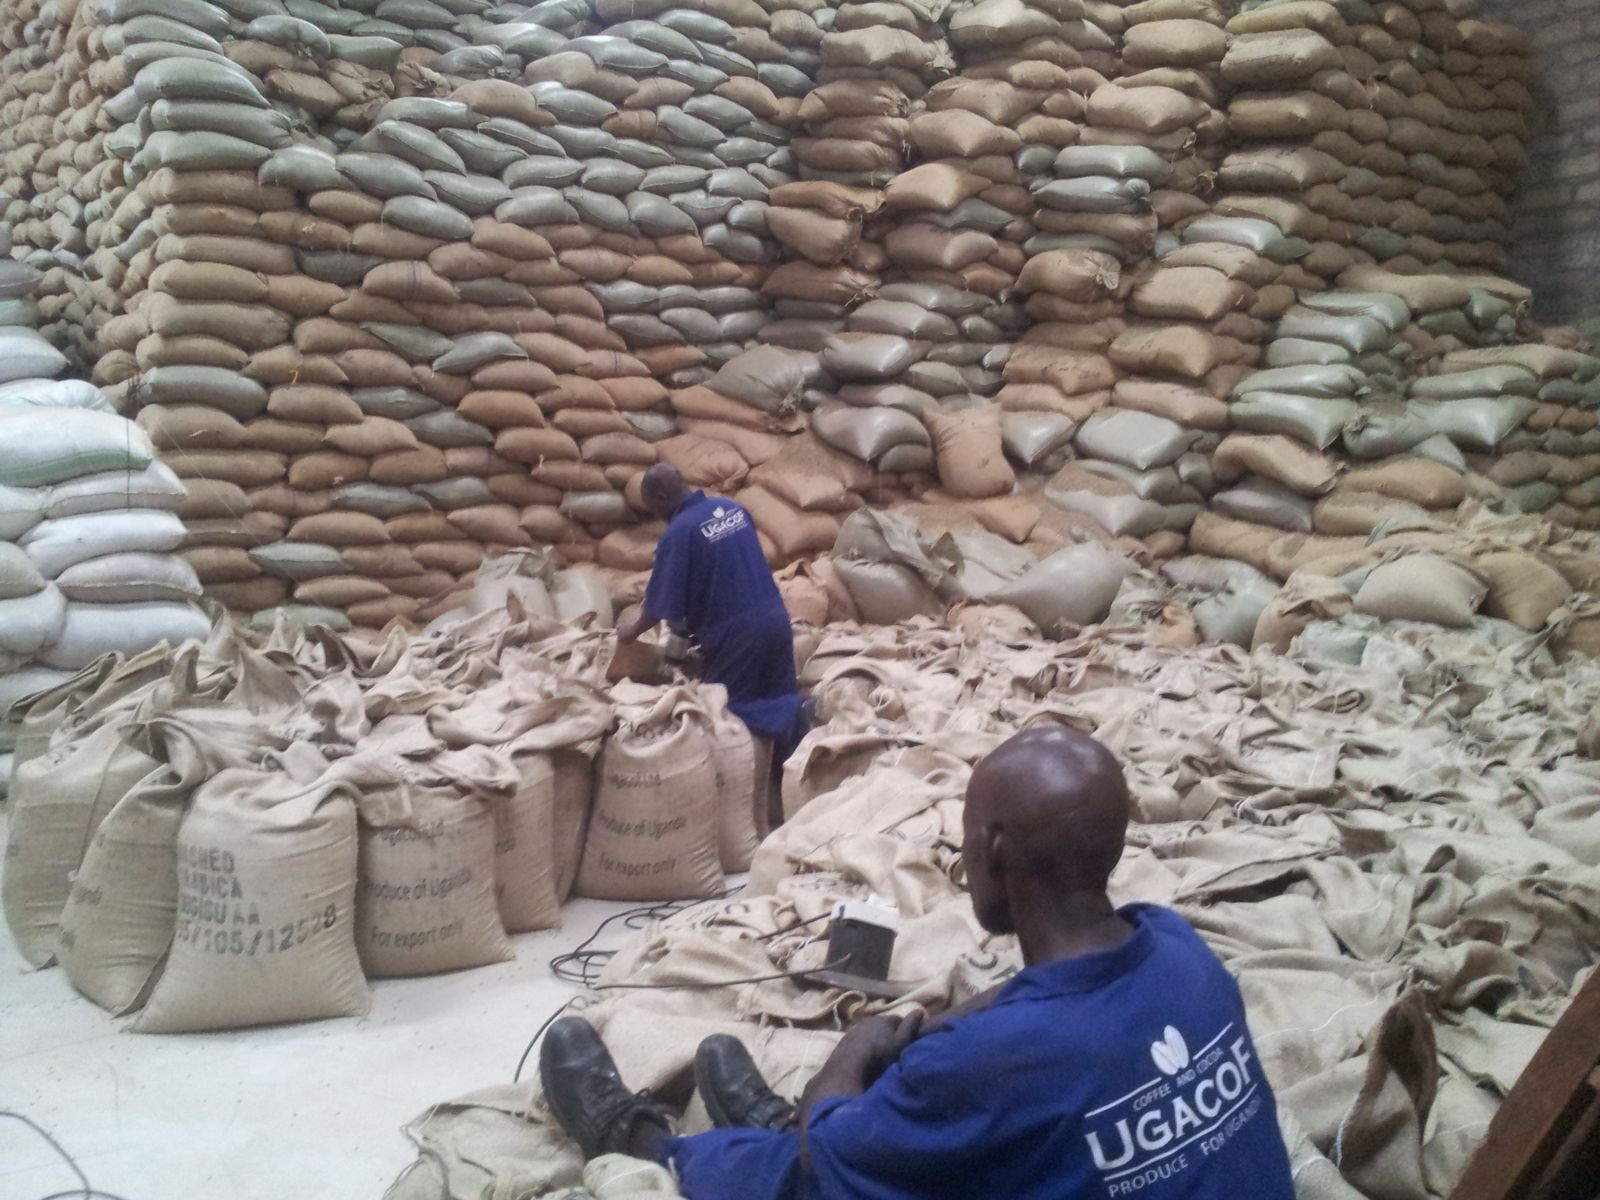
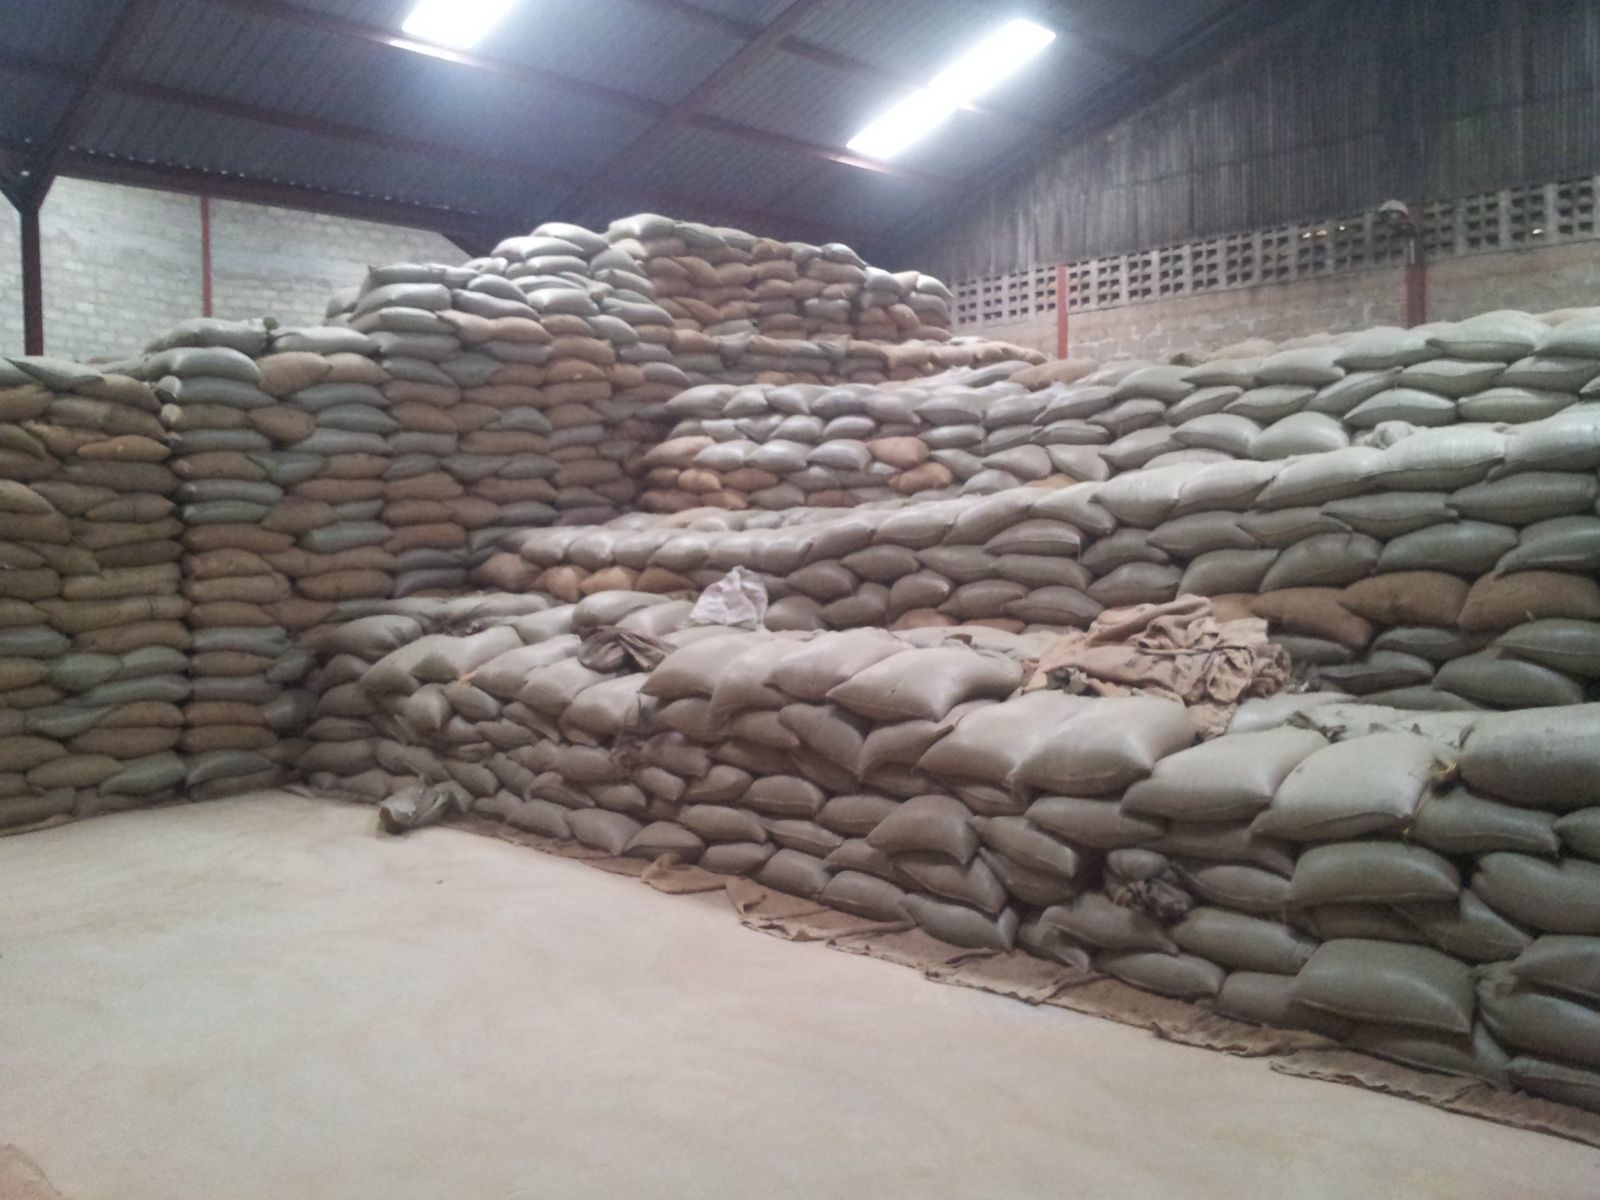
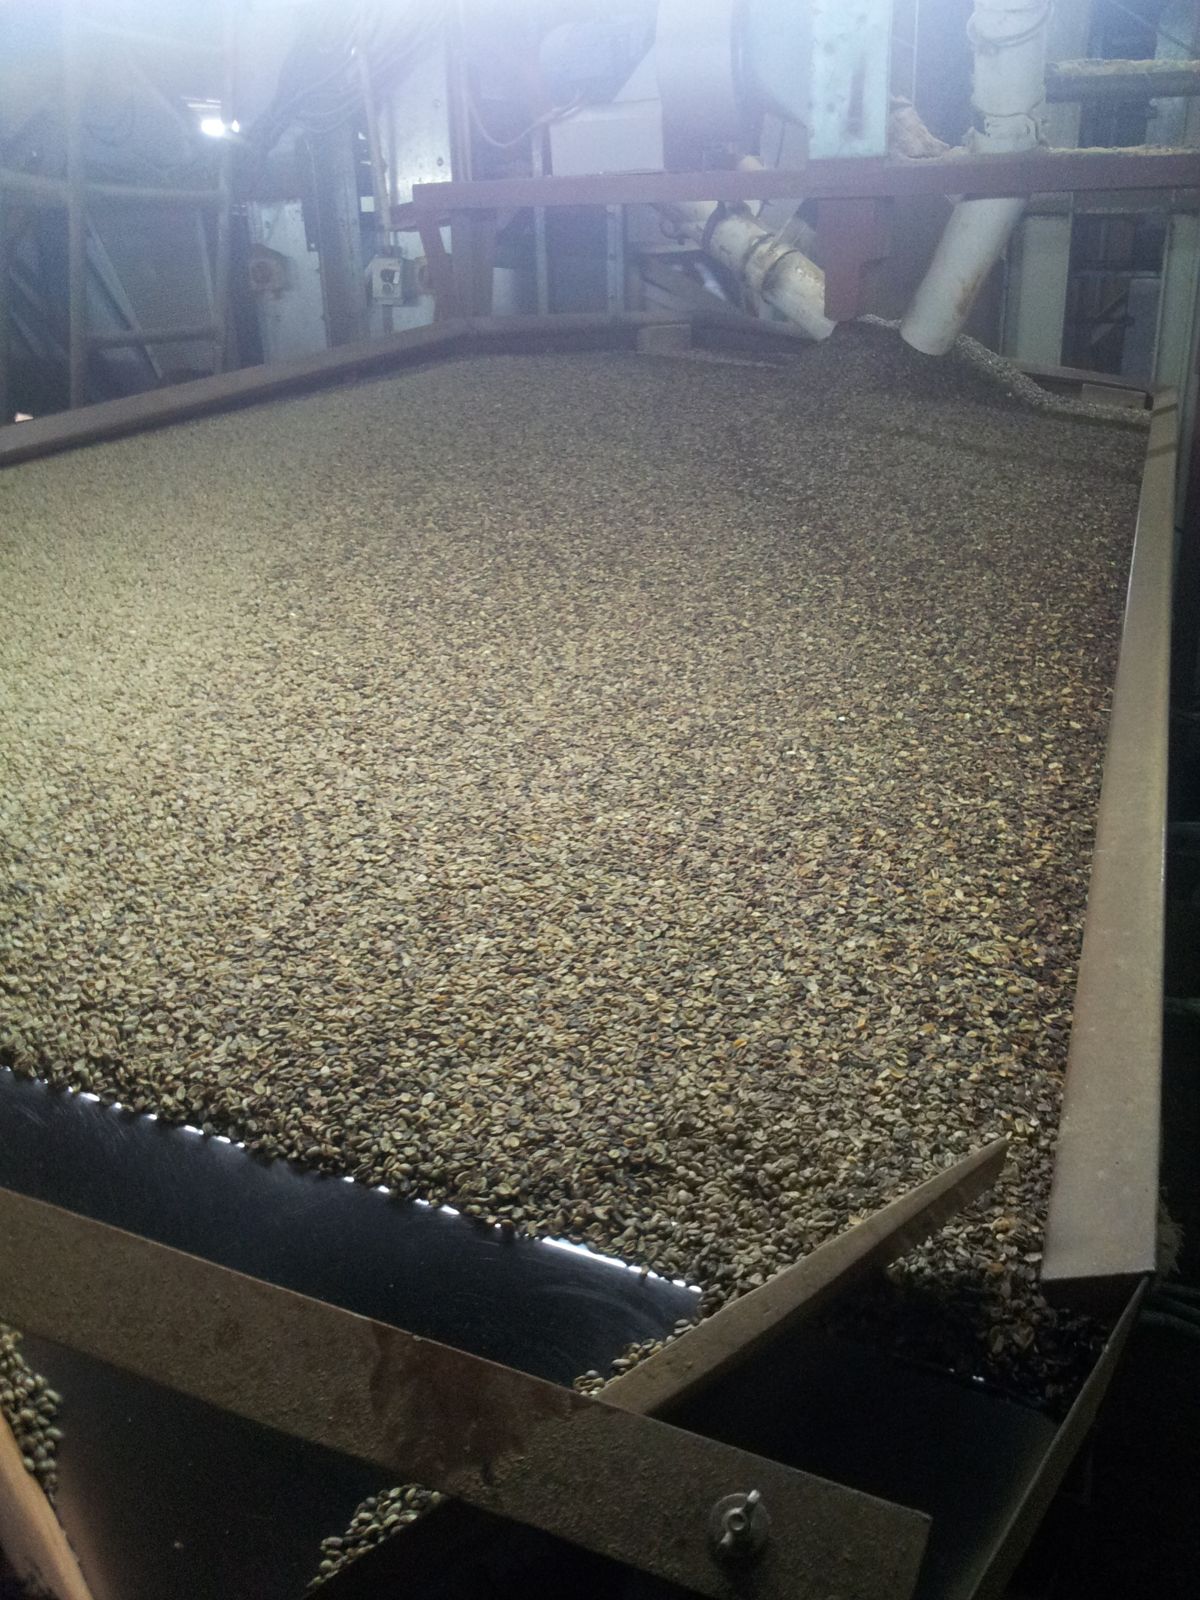
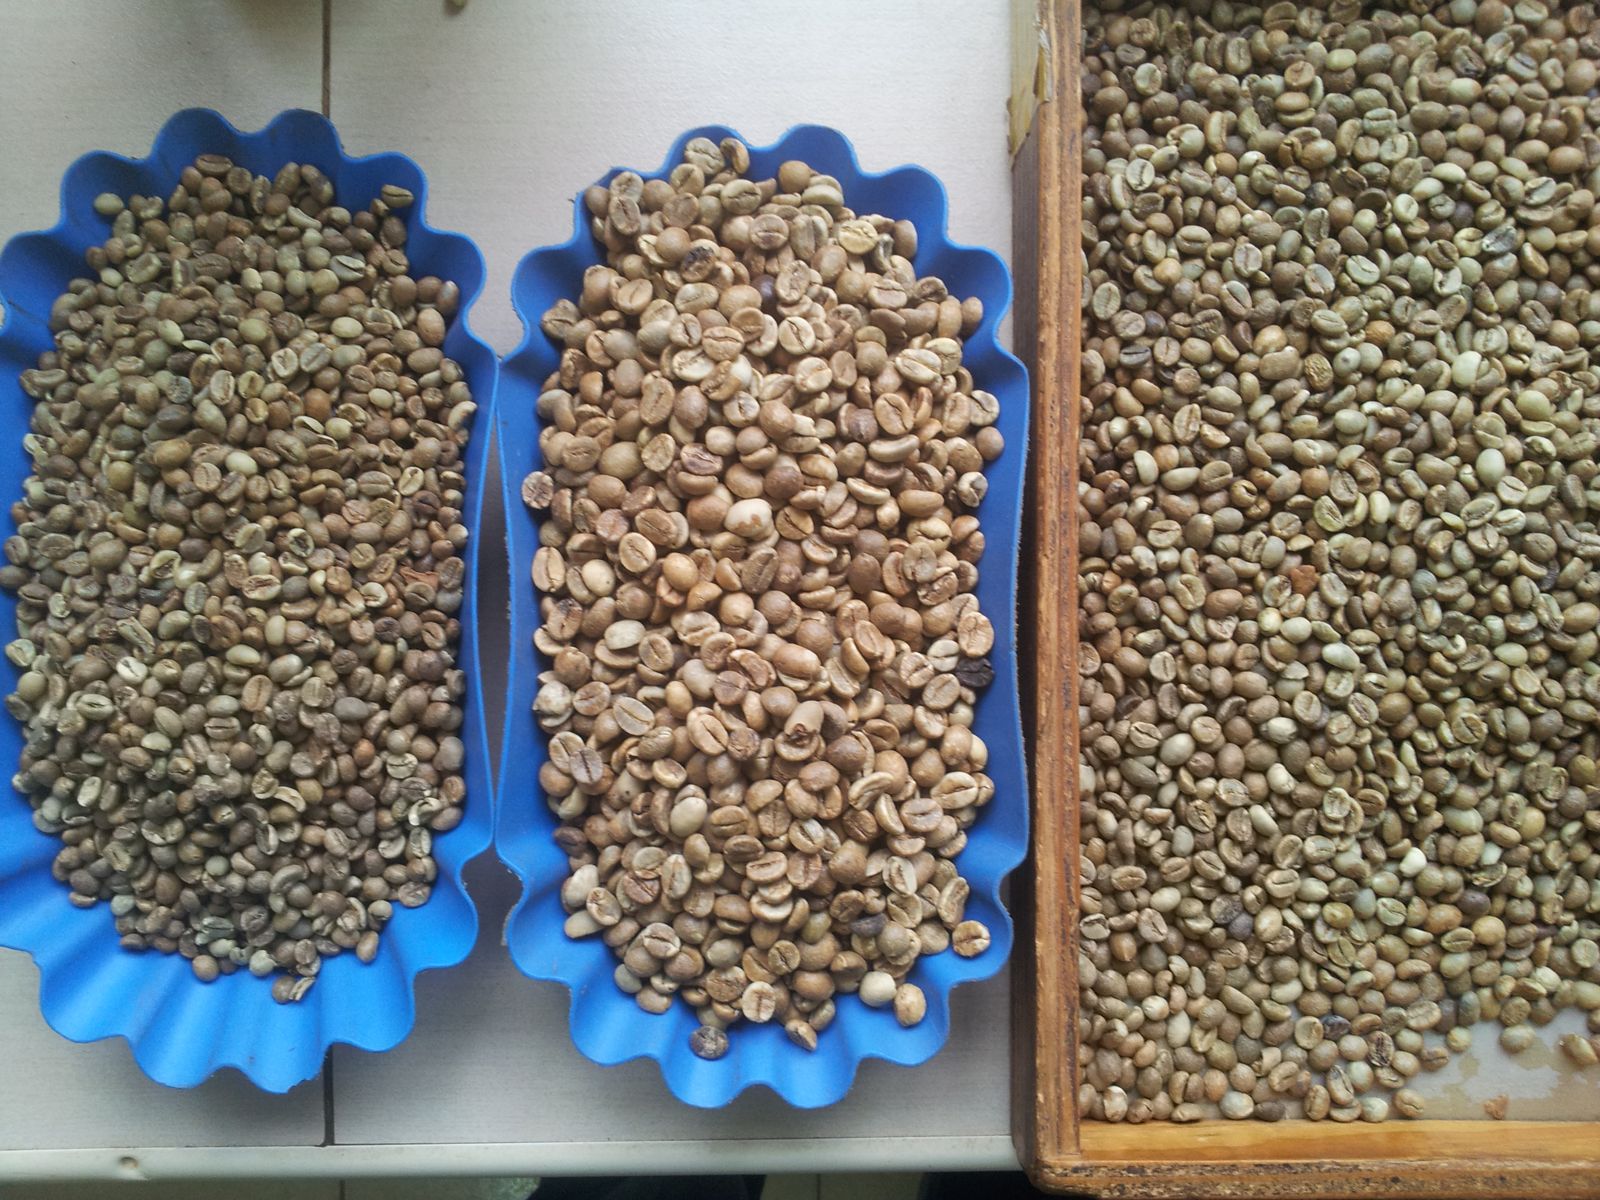
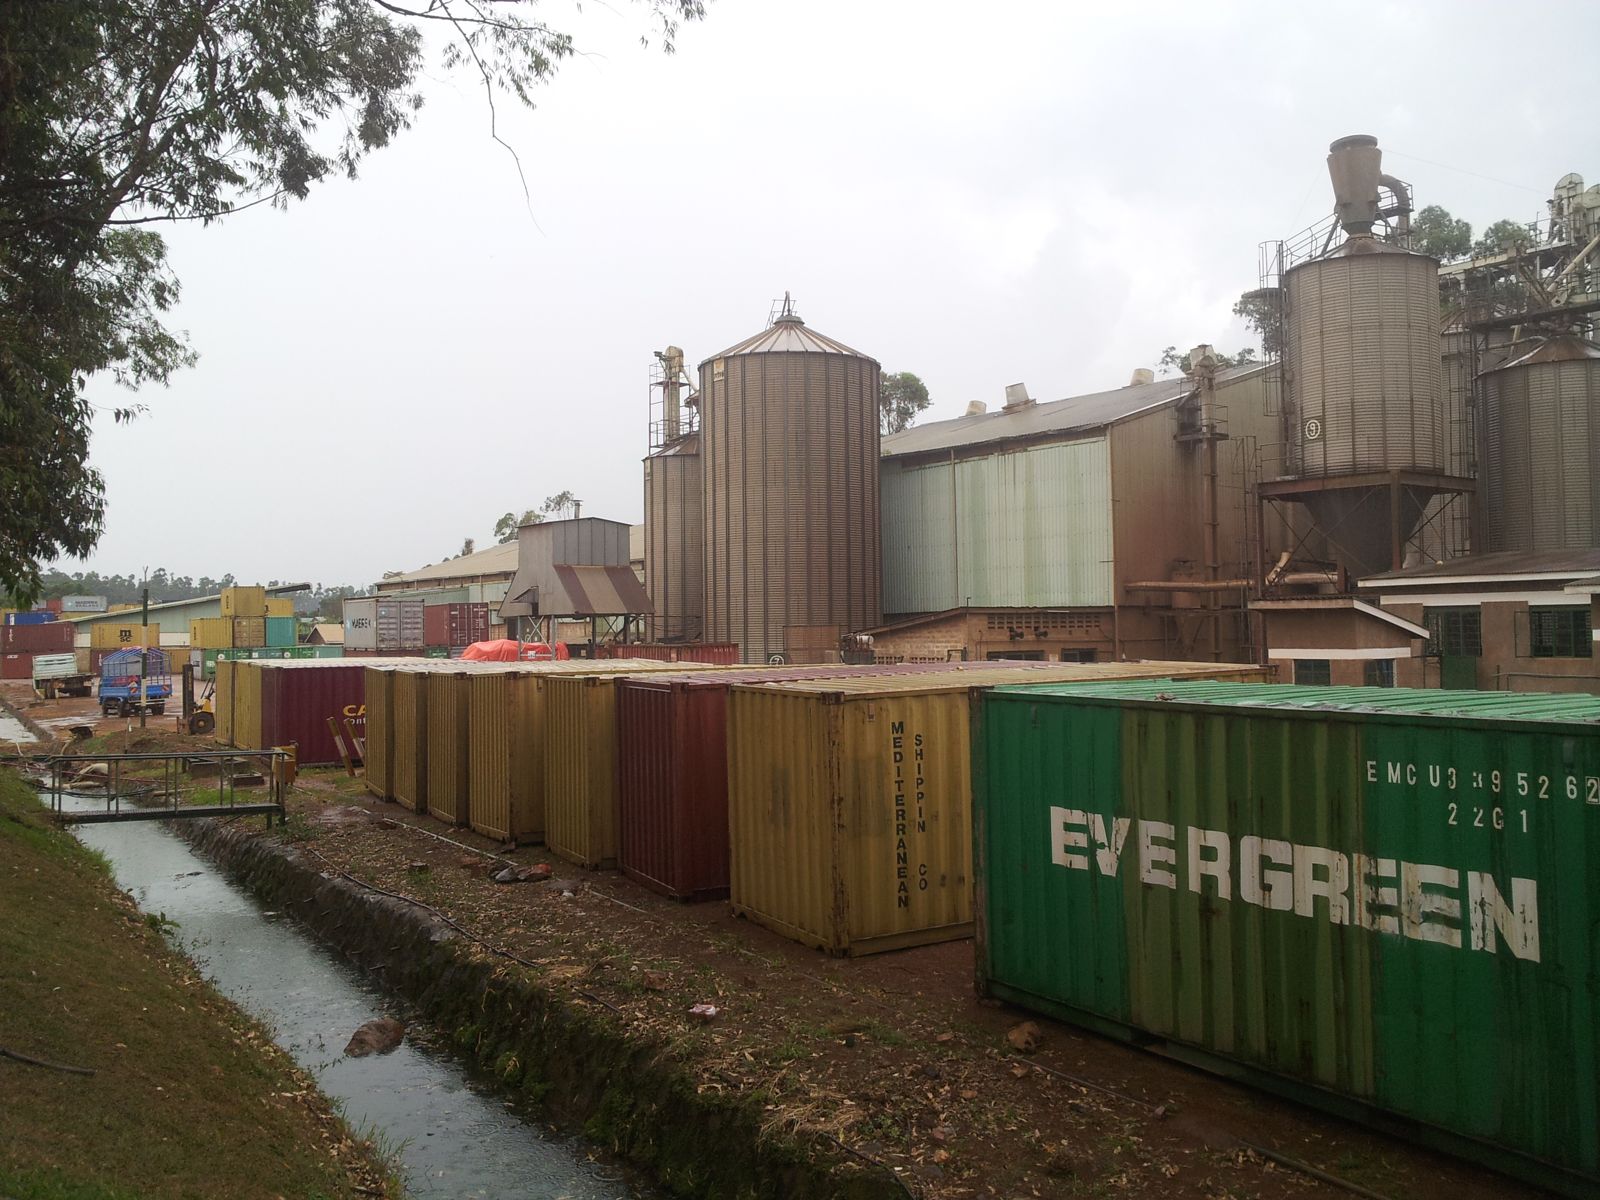
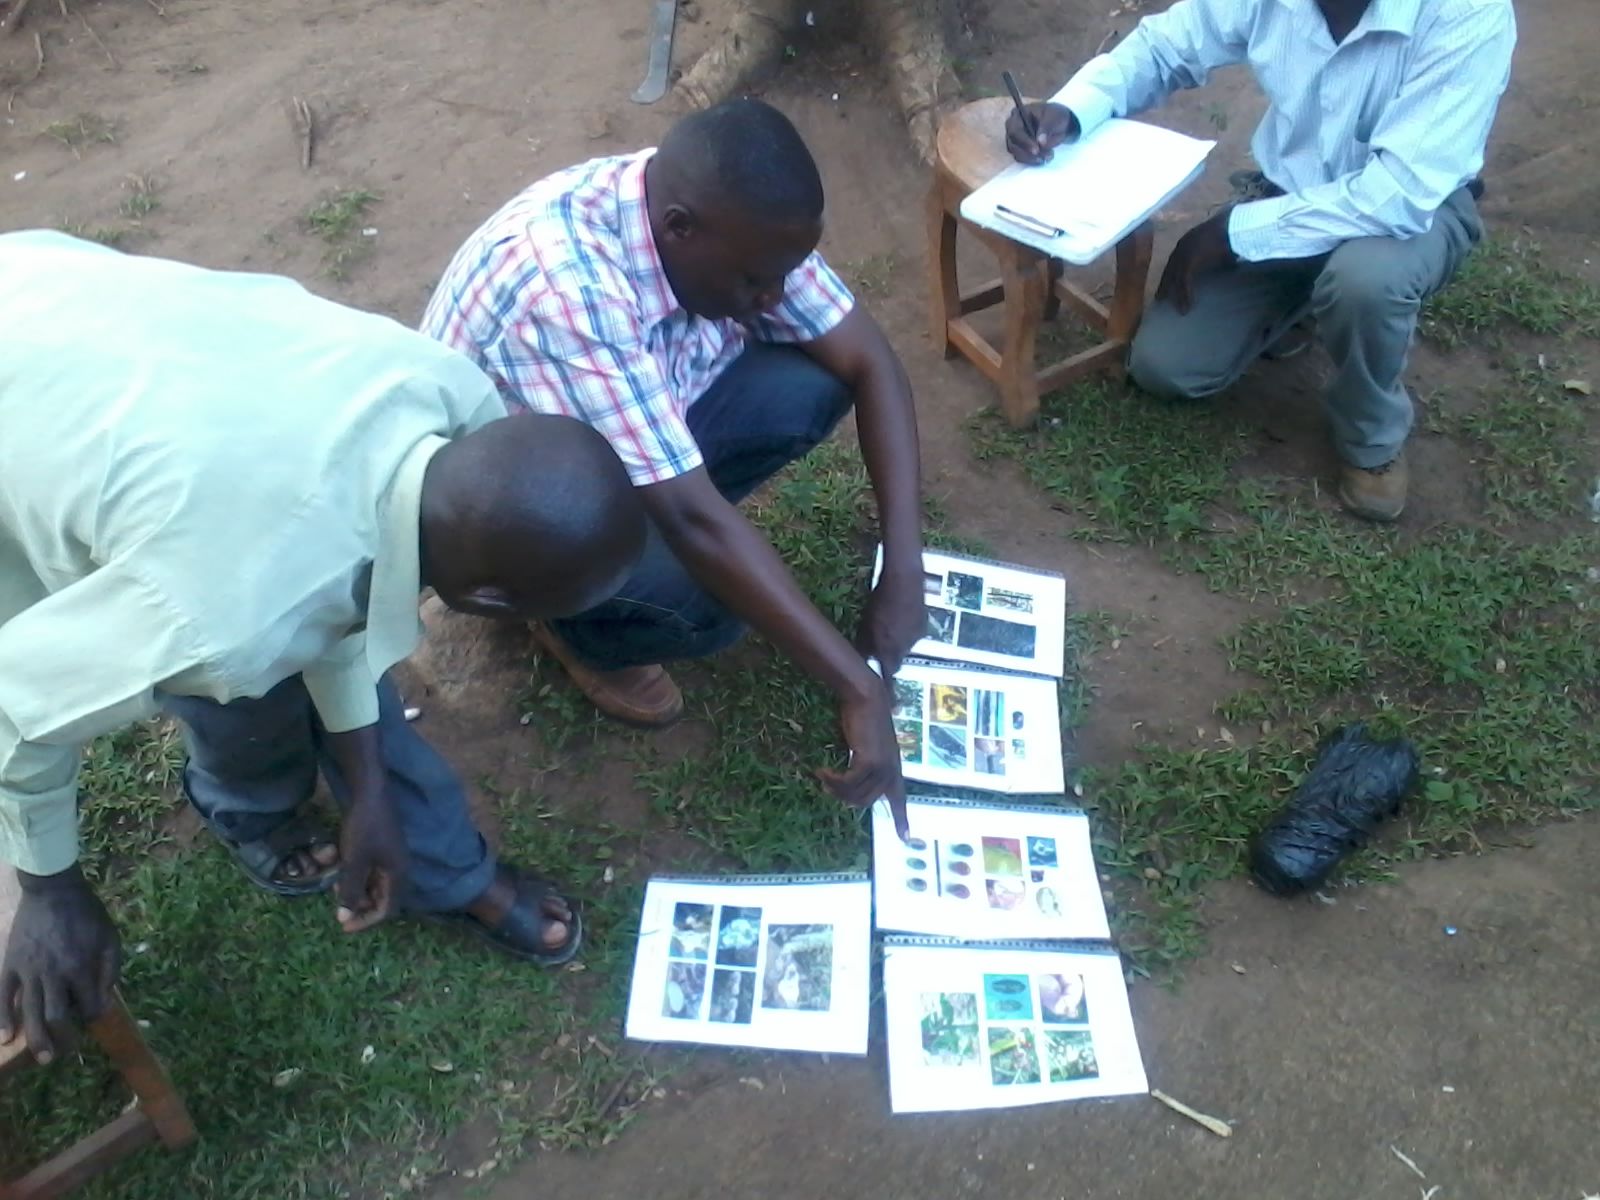
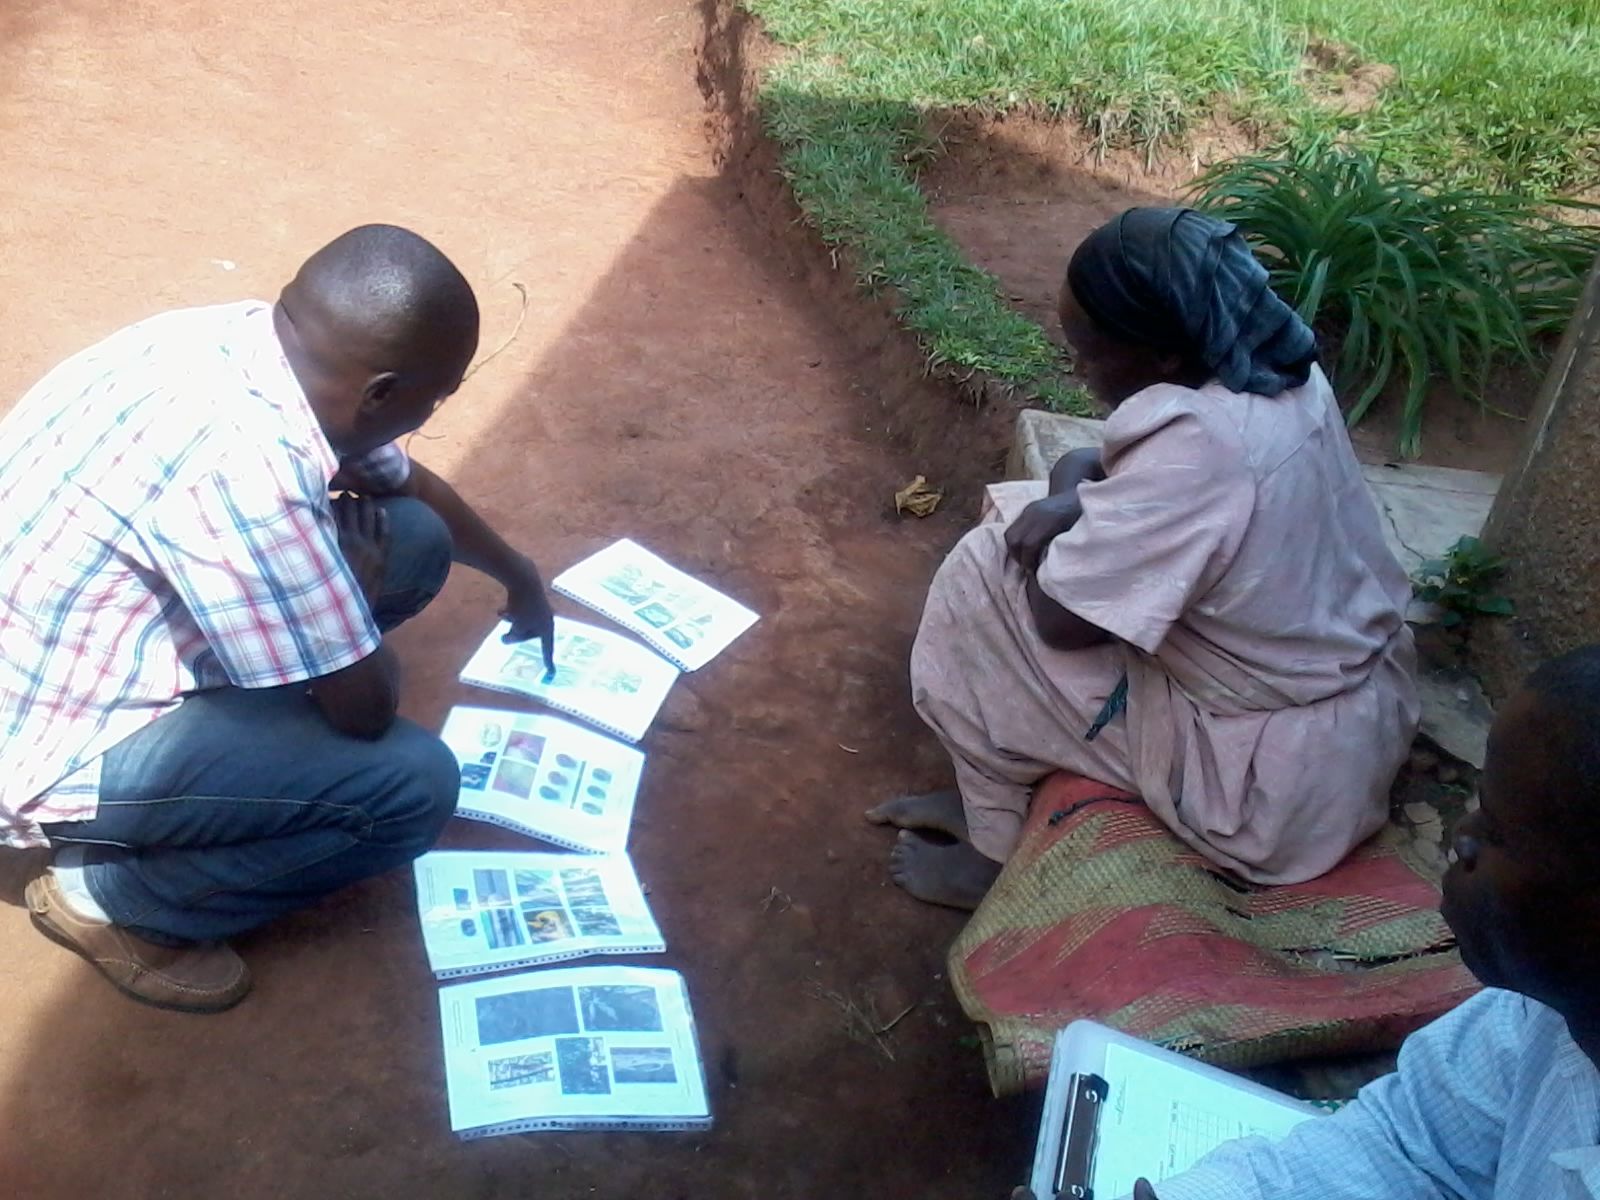
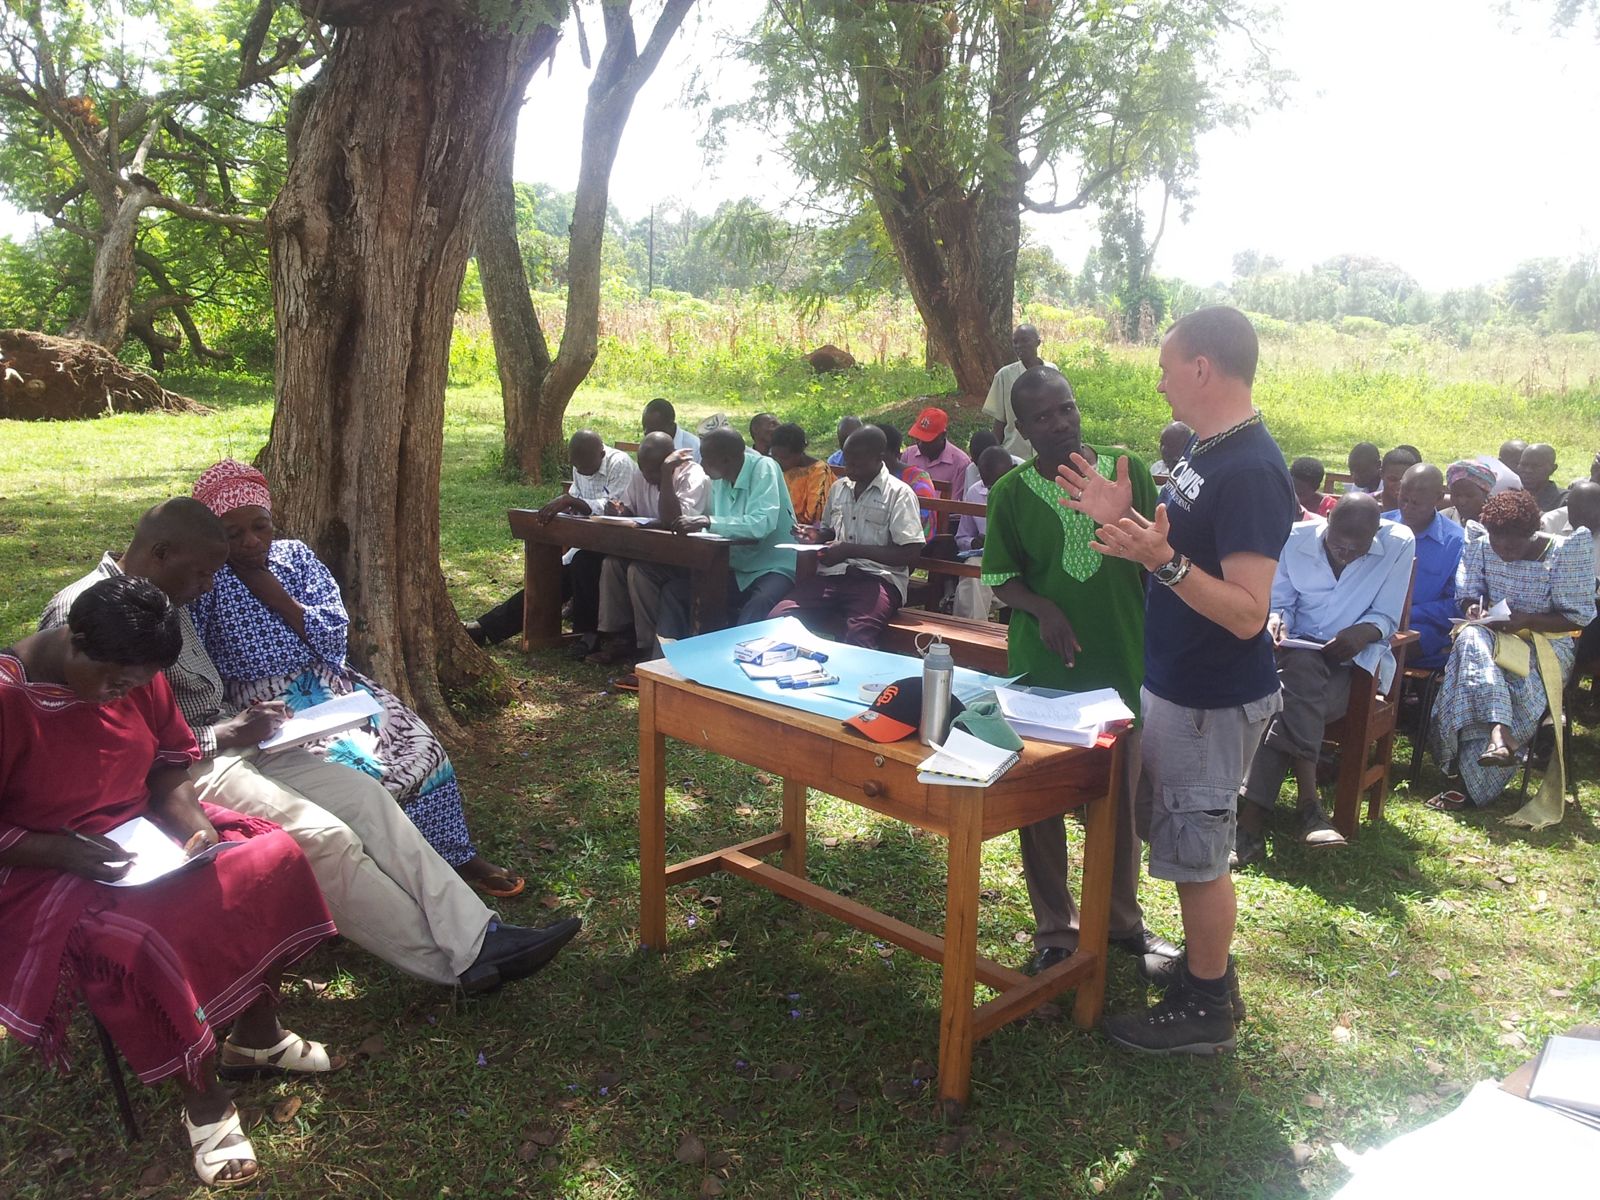
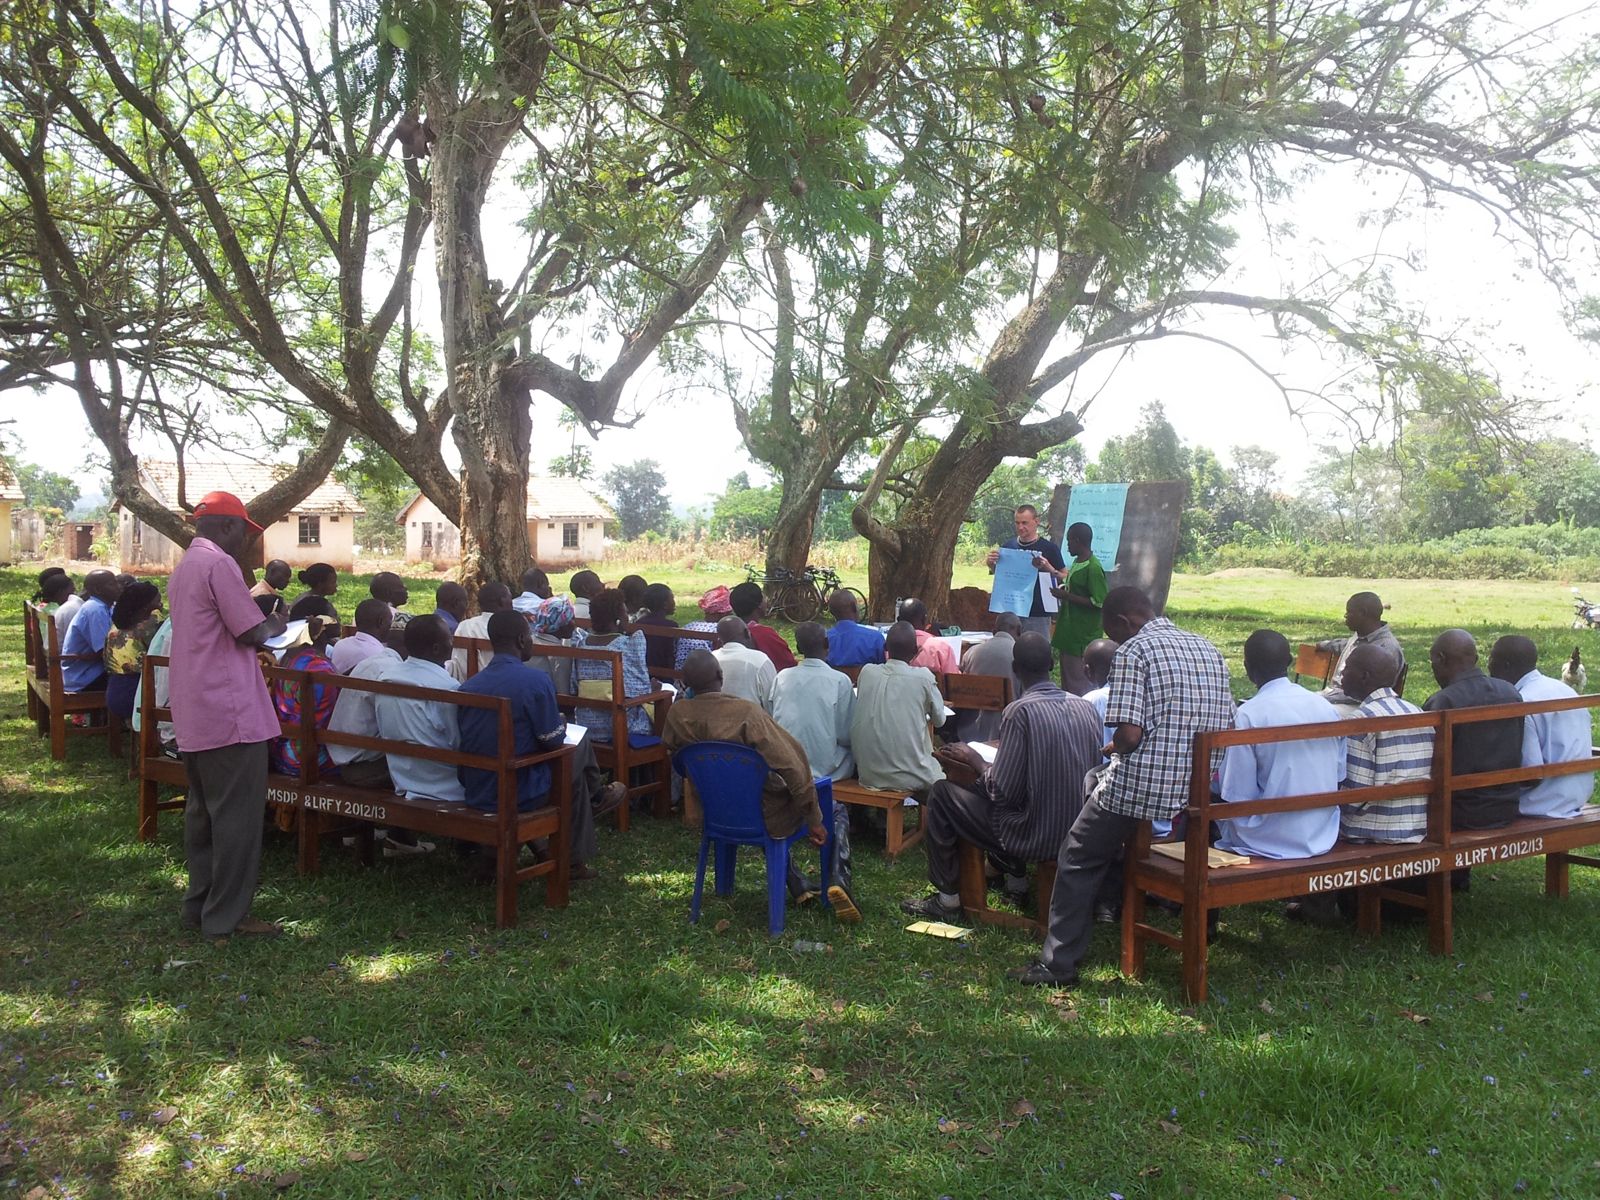
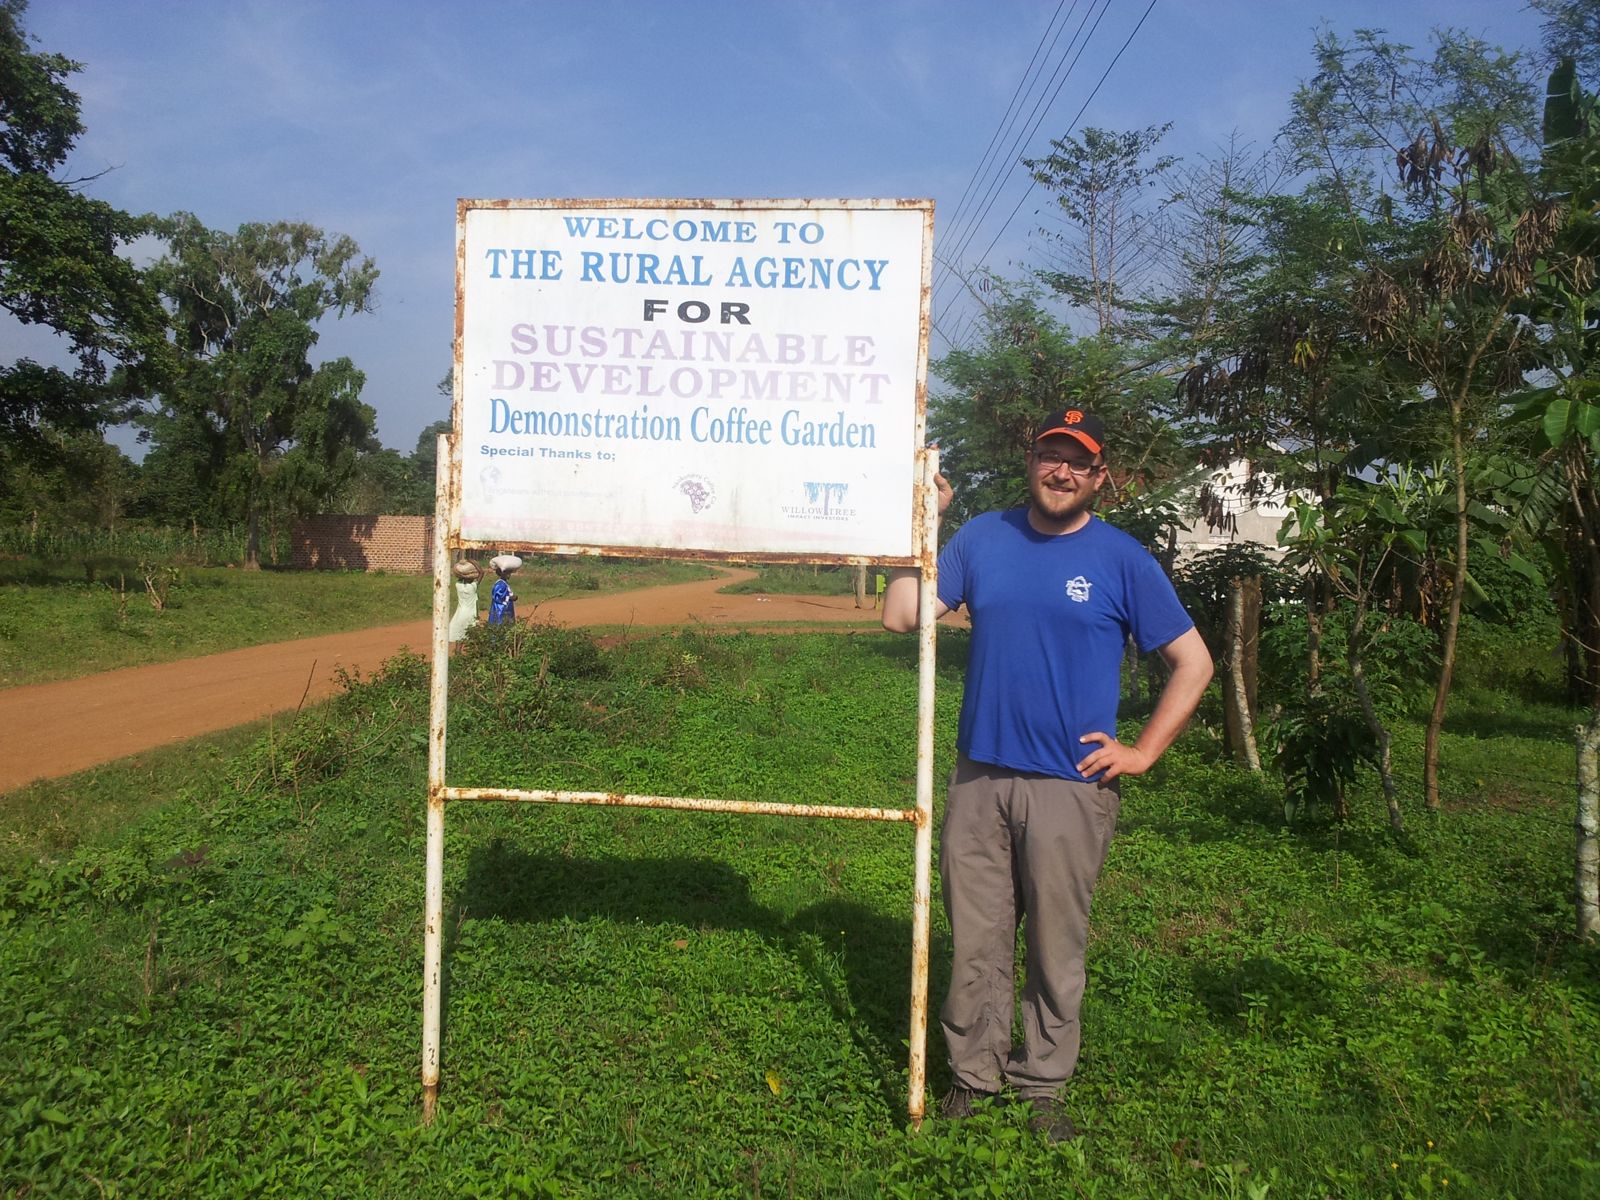
Pest explorer
Five pests and diseases of Ugandan Robusta. Traders ranked them from 1 (worst) to 5. Pick one to see how growers and traders saw it.
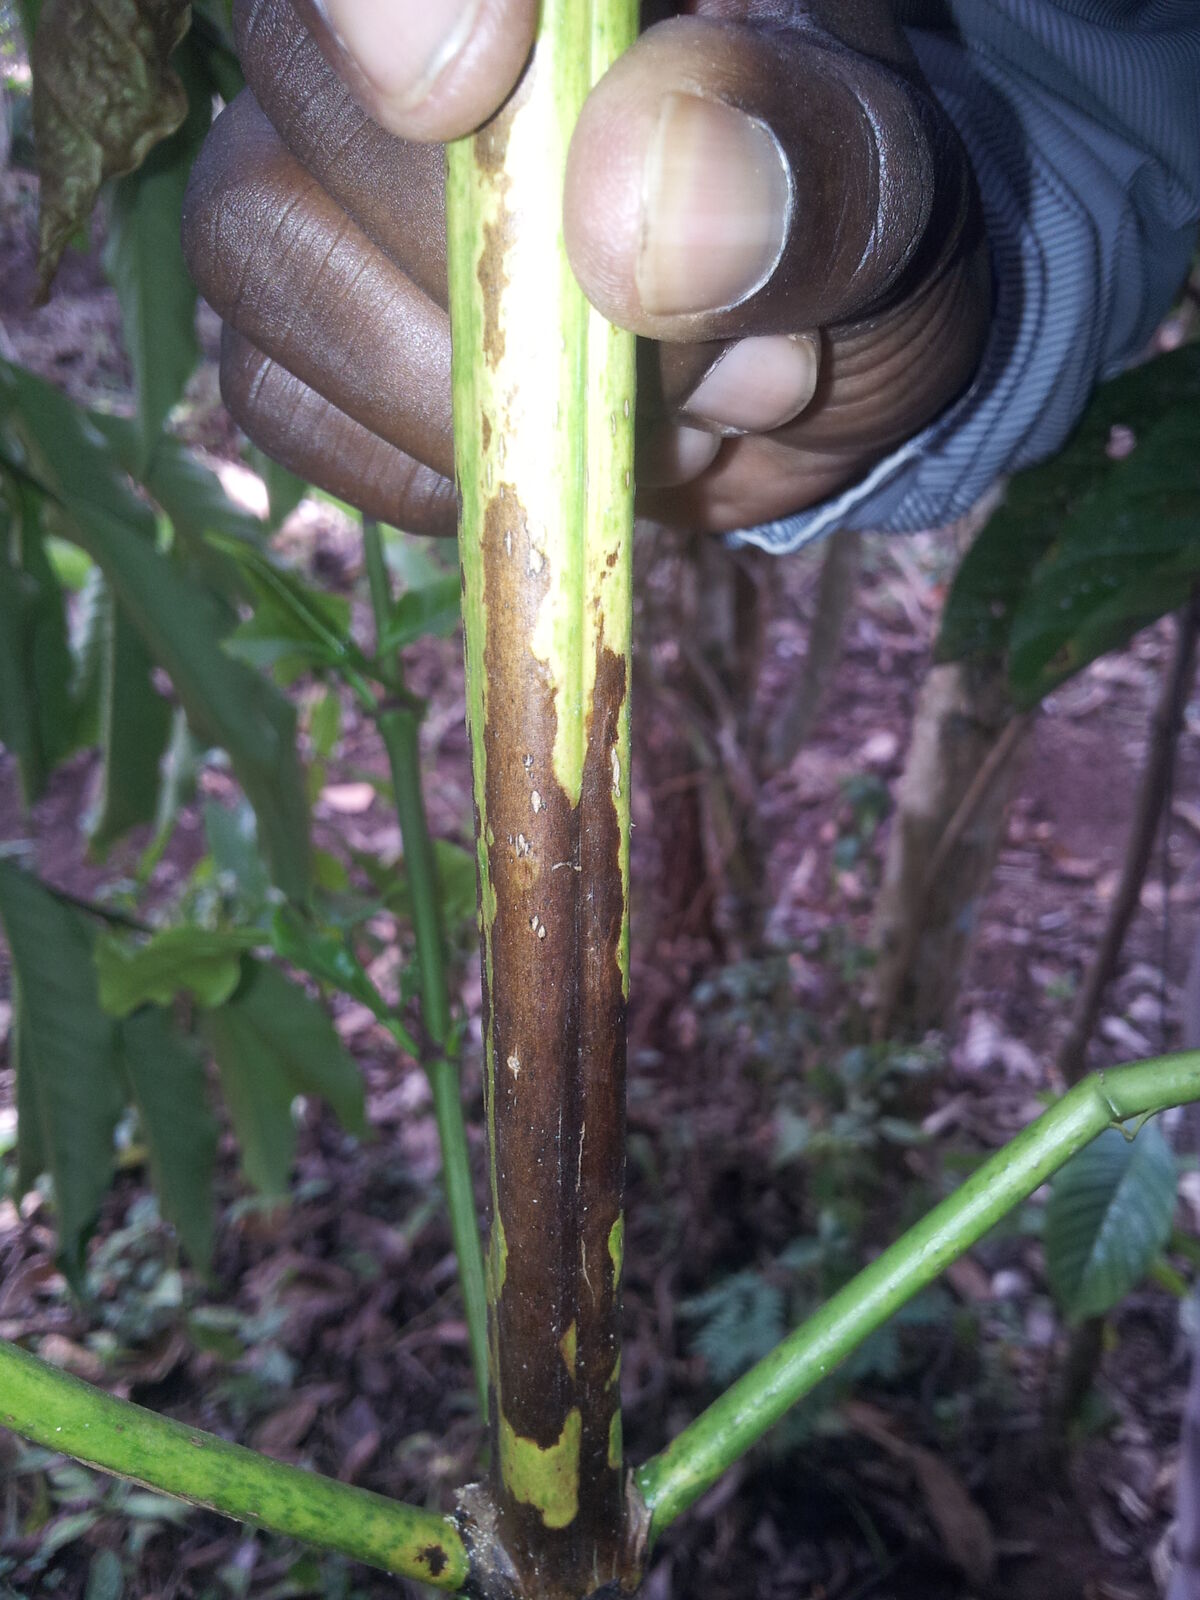
The disease that came across the border
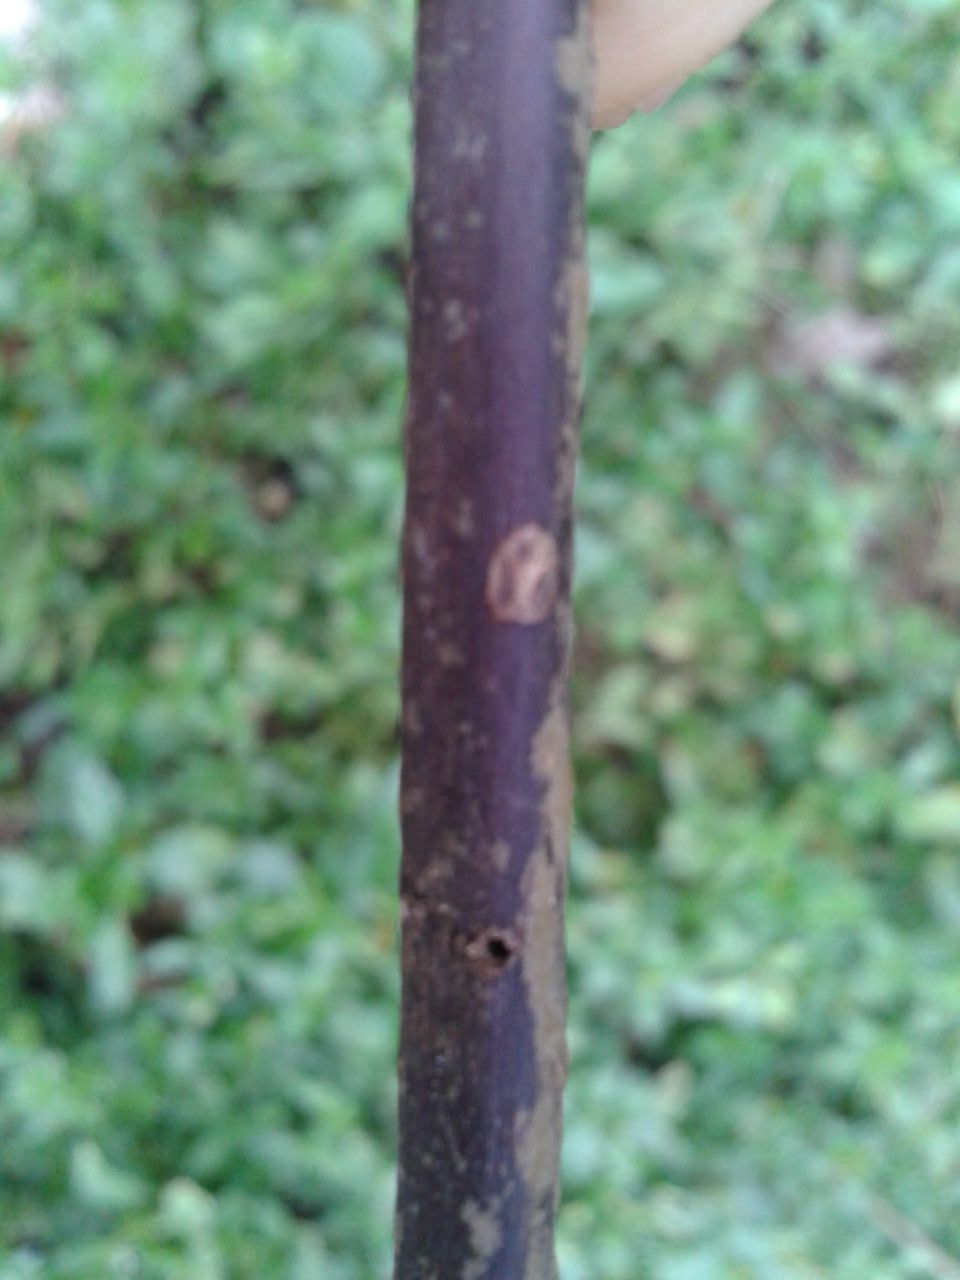
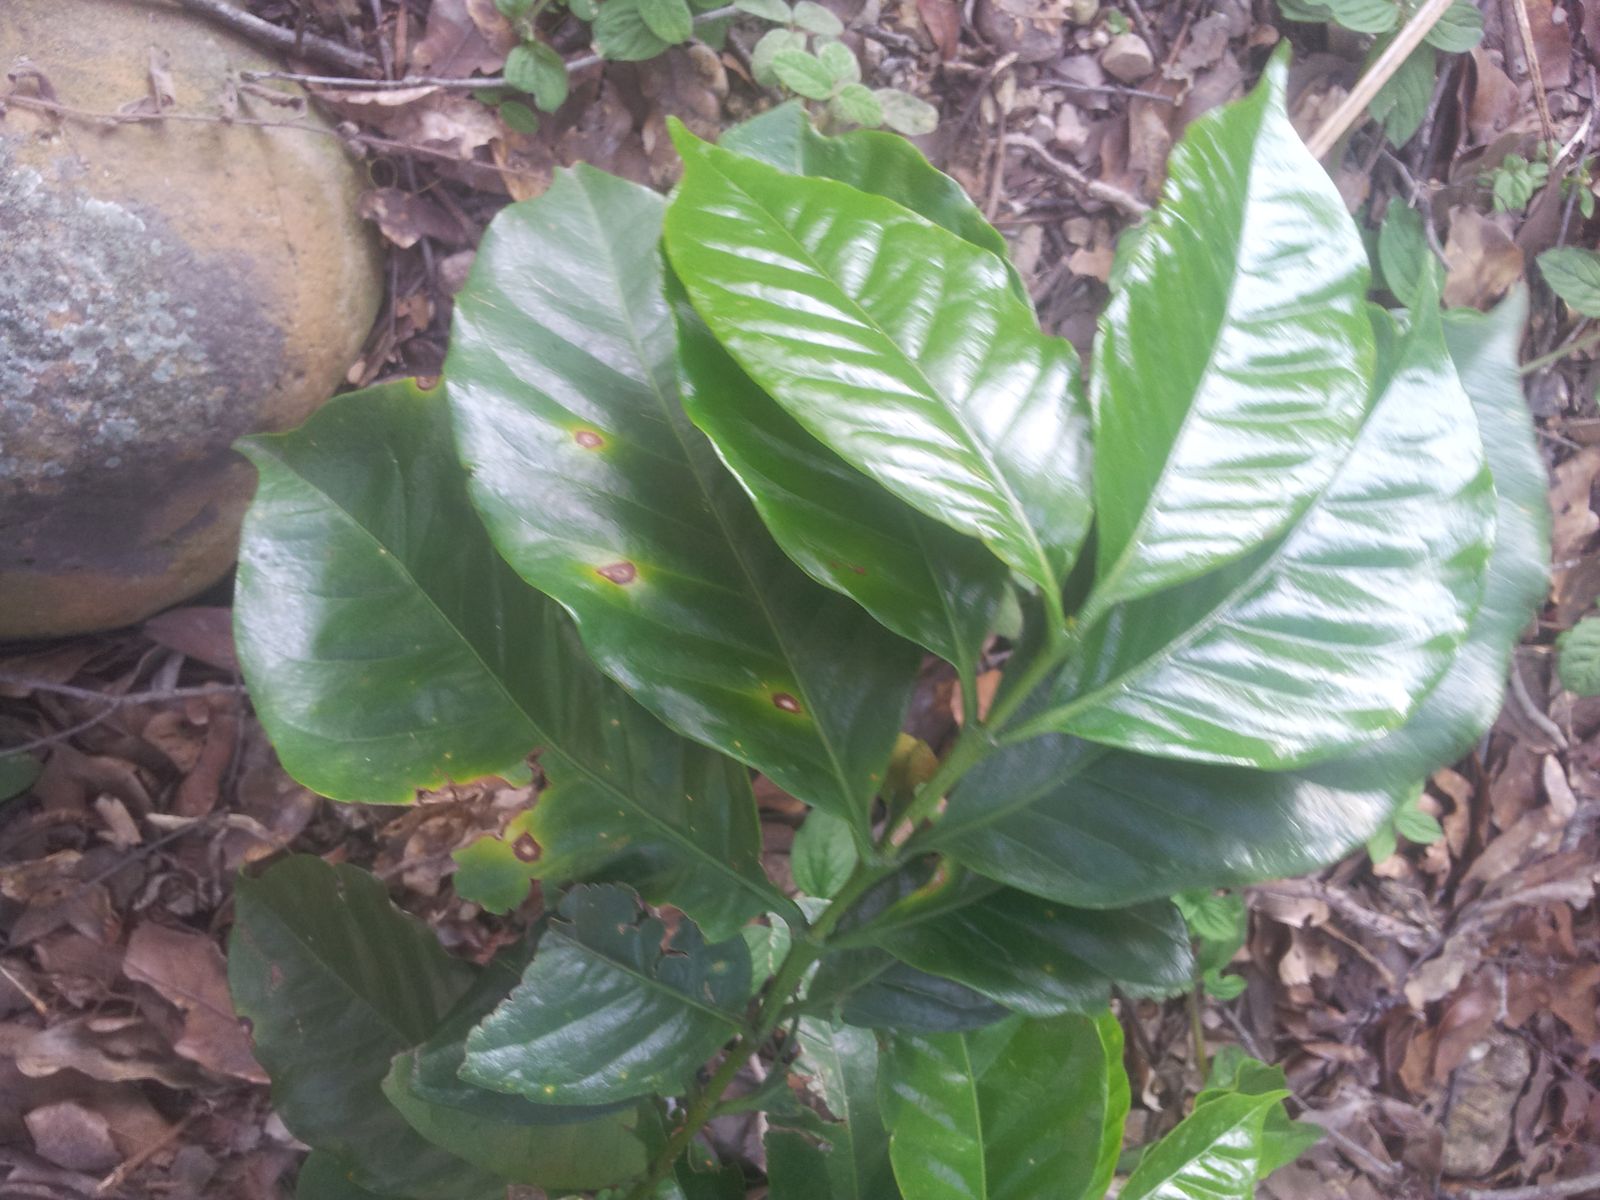
Coffee wilt is caused by a fungus that blocks the flow of water and nutrients inside a Robusta tree until the tree dies. On this stem, photographed during the fieldwork on 15 January 2014, the bark has been scraped back to show the stained wood beneath. Between its arrival from the Democratic Republic of Congo, probably in 1993, and the early 2000s, the disease killed around half of Uganda's Robusta trees. Uganda's coffee researchers have since developed seven wilt-resistant Robusta varieties, widely handed out in the decade or more before the survey.
Thesis pp. 151 and 388 to 389 (Appendix A.22.1).
Twig borer overtook wilt
Wilt is still the disease traders rank as most severe, but by 2013 twig borer was the problem they were seeing. Asked for the most significant pest problems, 41 of the 89 traders named wilt alone for 2012, against 35 for twig borer; for 2013, 58 named twig borer alone and 18 wilt. Growers already named twig borer more often, and the gap widened: of 119, 53 named it alone for 2012 and 75 for 2013, while those naming wilt alone fell from 35 to 14.
Lee's survey data (growers asked about this year and last year, traders about 2013 and 2012). Not reported in the thesis.
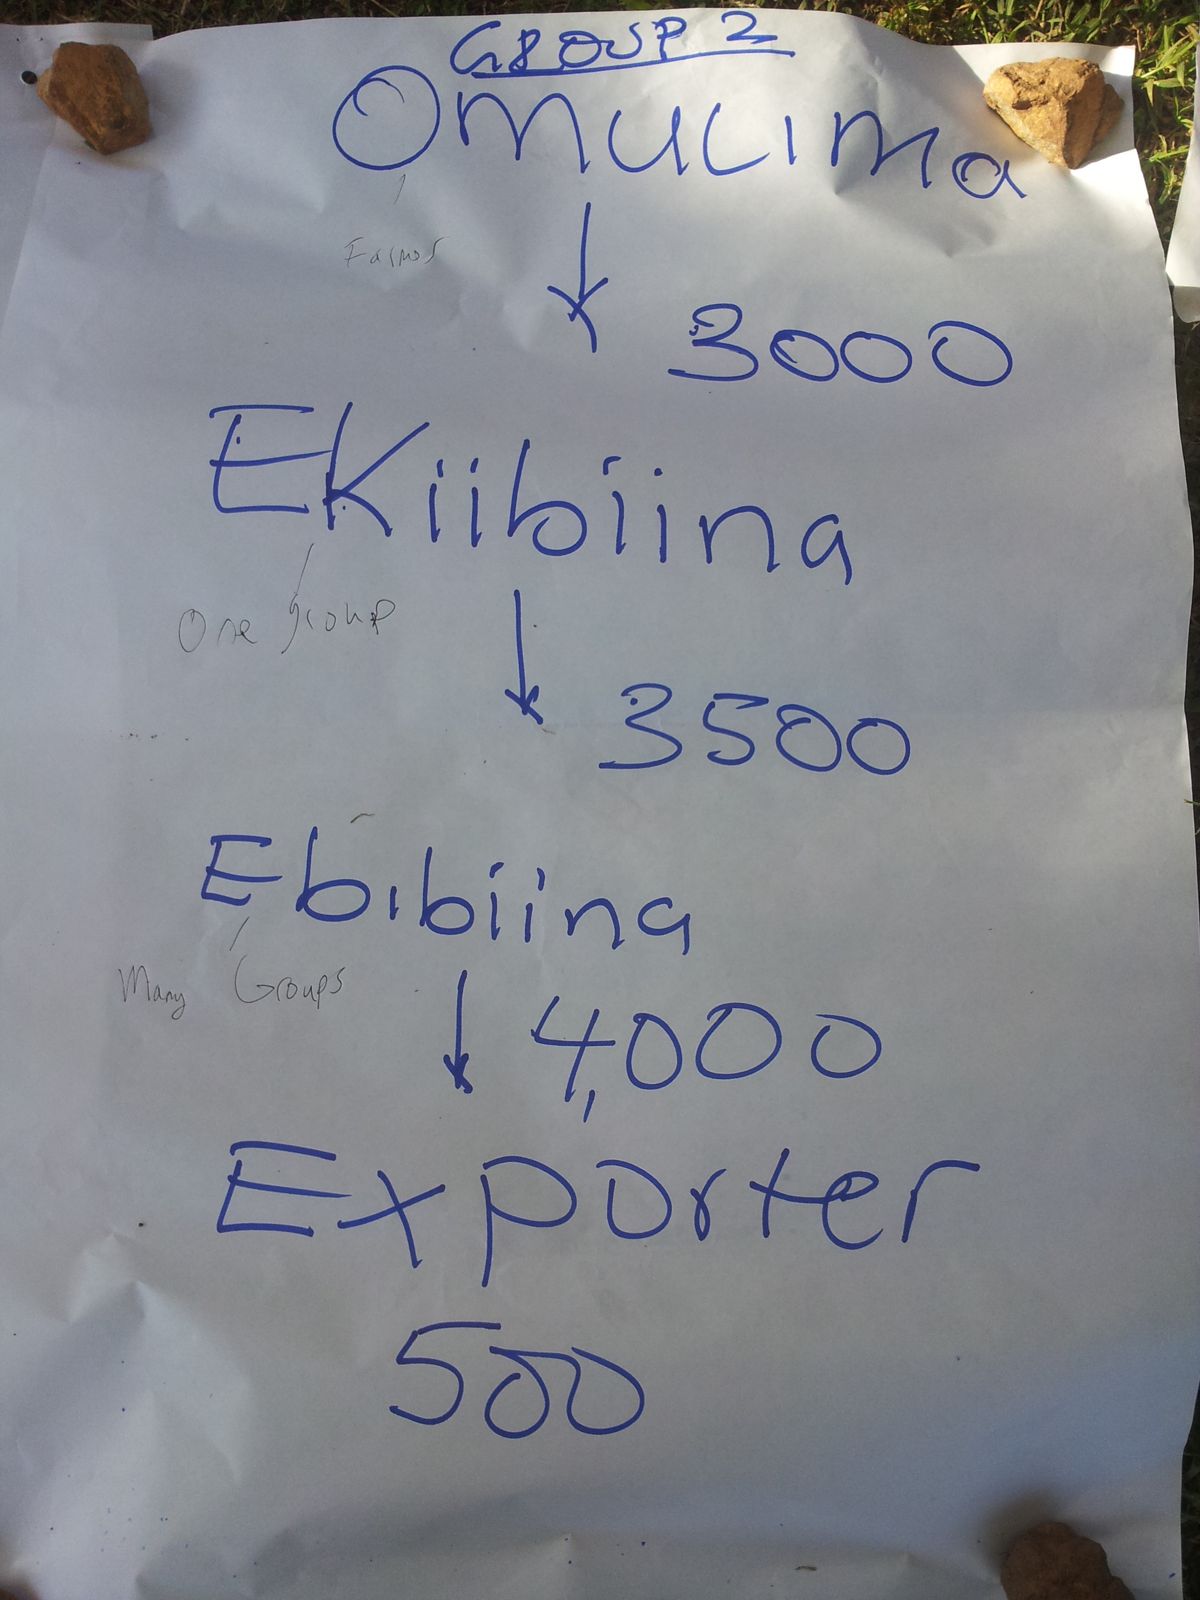
Where the money goes
At the workshop, each group drew the chain from tree to export, assuming an export price of 5,000 shillings per kilo.
What the farmers decided
Most tend their trees, few spray
About seven in ten farmers pruned, cleared dead trees or did something else against pests, about half used fertiliser, and only one in ten sprayed. Many did not believe pruning works when their neighbours do not prune either.
Organised farmers do more
Members of a cooperative in Kamuli fertilised far more often: 87% of the 31 members surveyed, against 53% of growers in Buikwe and Kayunga. But the NGO running it lacked the capital to buy all its members' coffee, and certification lapsed when grants ended.
10 bags against 40
Exporters said Ugandan Robusta averaged about 10 bags per hectare, against about 40 in Vietnam. Certified coffee was around 5% of one exporter's sales in its best years.
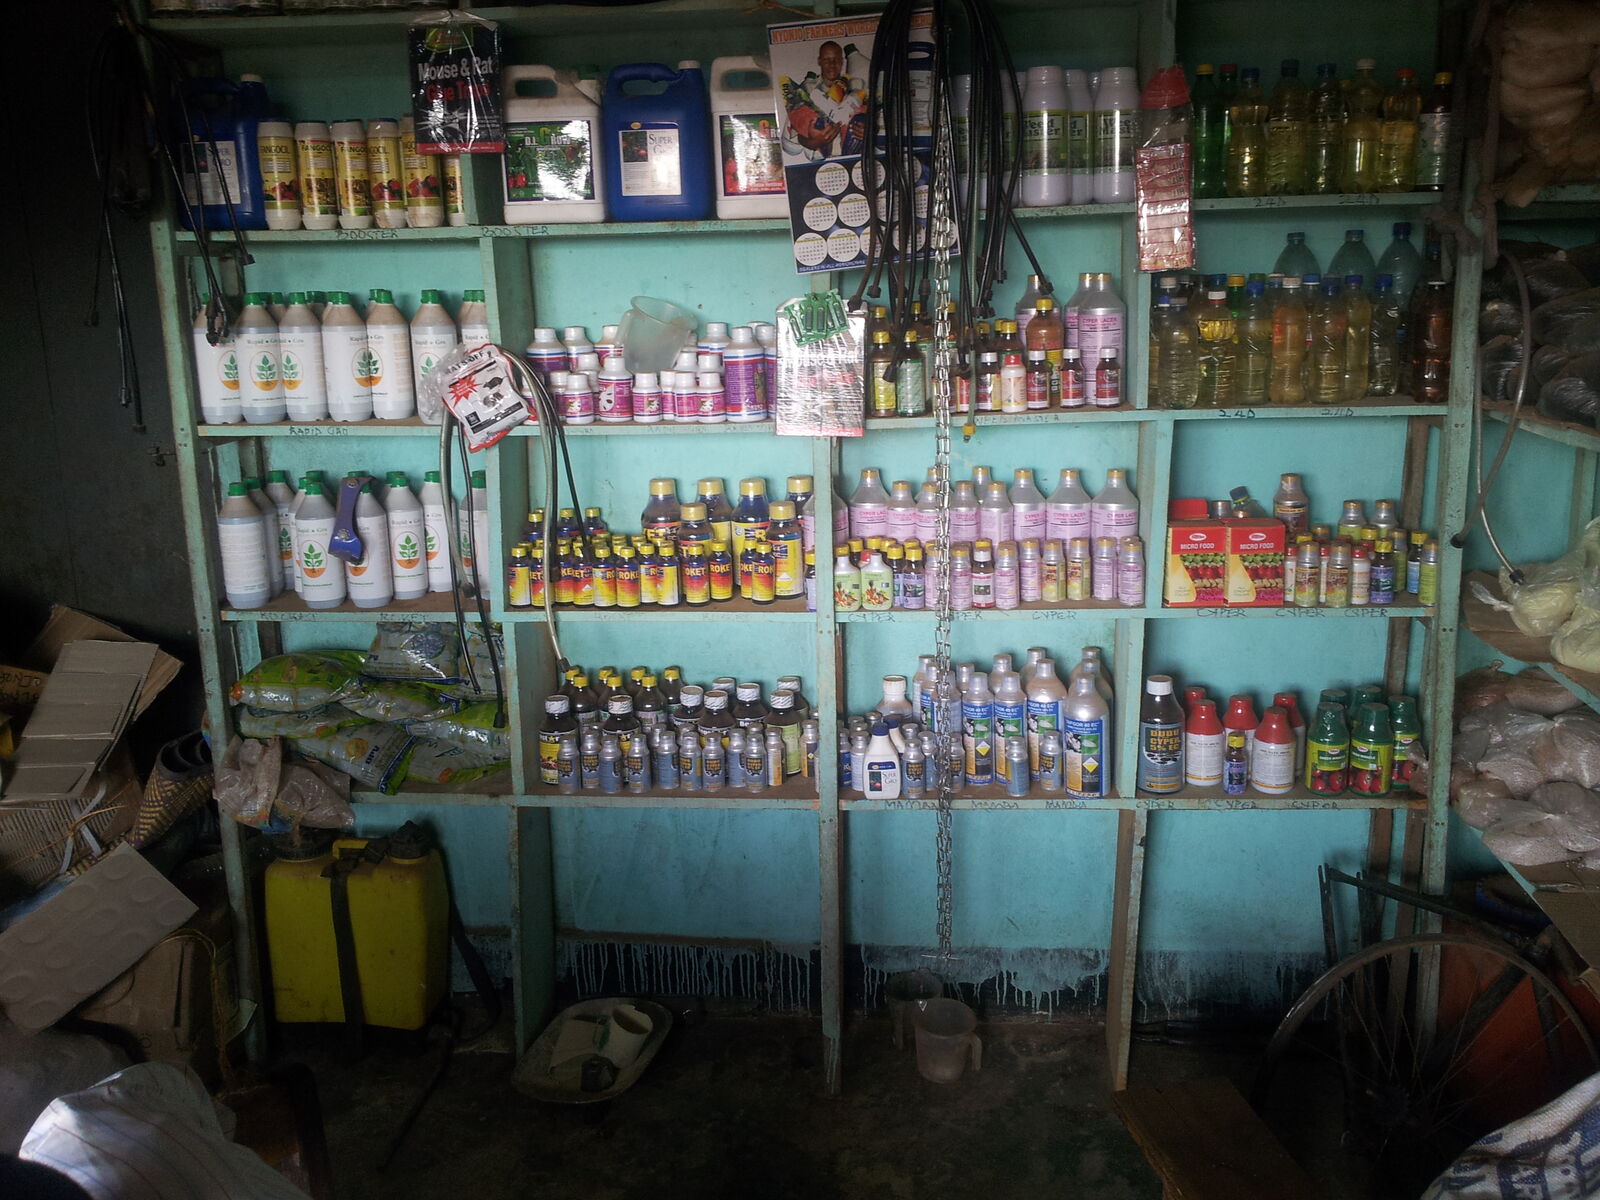
Sprays on the shelf, no agreed advice
A farm-supply shop in Nkokonjeru. Against twig borer, the government extension service recommended one spray, the coffee research institute another, and the town's farm-supply shop a third. No wonder farmers said they did not know how to treat the pests.
Thesis pp. 292 to 293 (Figure 78).
Most of the growers were women
74 of the 119 growers interviewed in Buikwe and Kayunga were women. Single women stood apart: just over a third of them asked no one for advice about their coffee, against 8% of the other growers, and nearly half (48%) sold only wet cherry straight off the tree rather than drying it first, against about a third (34%) of everyone else.
Thesis pp. 277 to 282 (Figures 71 and 72).
"[It is] a lot of work to do agriculture and coffee needs to be worth it."Project officer at a Kamuli farmer cooperative, interviewed for the thesis
Survey team: Lee Pearson, Ignitius Bwoogi, Neil McRoberts, George Kawa, Anthony Kisitu and Paul Kisseki. Photos were taken with the consent of the people taking part in the research, who were paid for their time through the risk game. At the Nkokonjeru workshop, everyone was given lunch and the winning market-game team a cash prize; in Kamuli, at the request of the NGO that runs the cooperative, the members surveyed were given lunch at their workshop instead of cash (thesis pp. 164, 222 and 248).
The risk games
Development programmes often assume smallholders are deeply risk-averse. Lee measured it instead, with two games: a bag of marbles at the end of every household survey, and a full coffee market simulation with traders, a market maker and a contract. Play them, and each choice you make is set beside the people who actually played them.
Bag A or Bag B?
How much risk will you take for more money?
- 119 coffee growers and 89 coffee traders, Buikwe and Kayunga
- 138 adults at the Imperial Festival, London
Not played yet
The coffee market
Will you keep a steady-price deal when the market pays more?
- 6 teams of farmers and traders · RASD workshop, Nkokonjeru, 11 January 2014
Not played yet
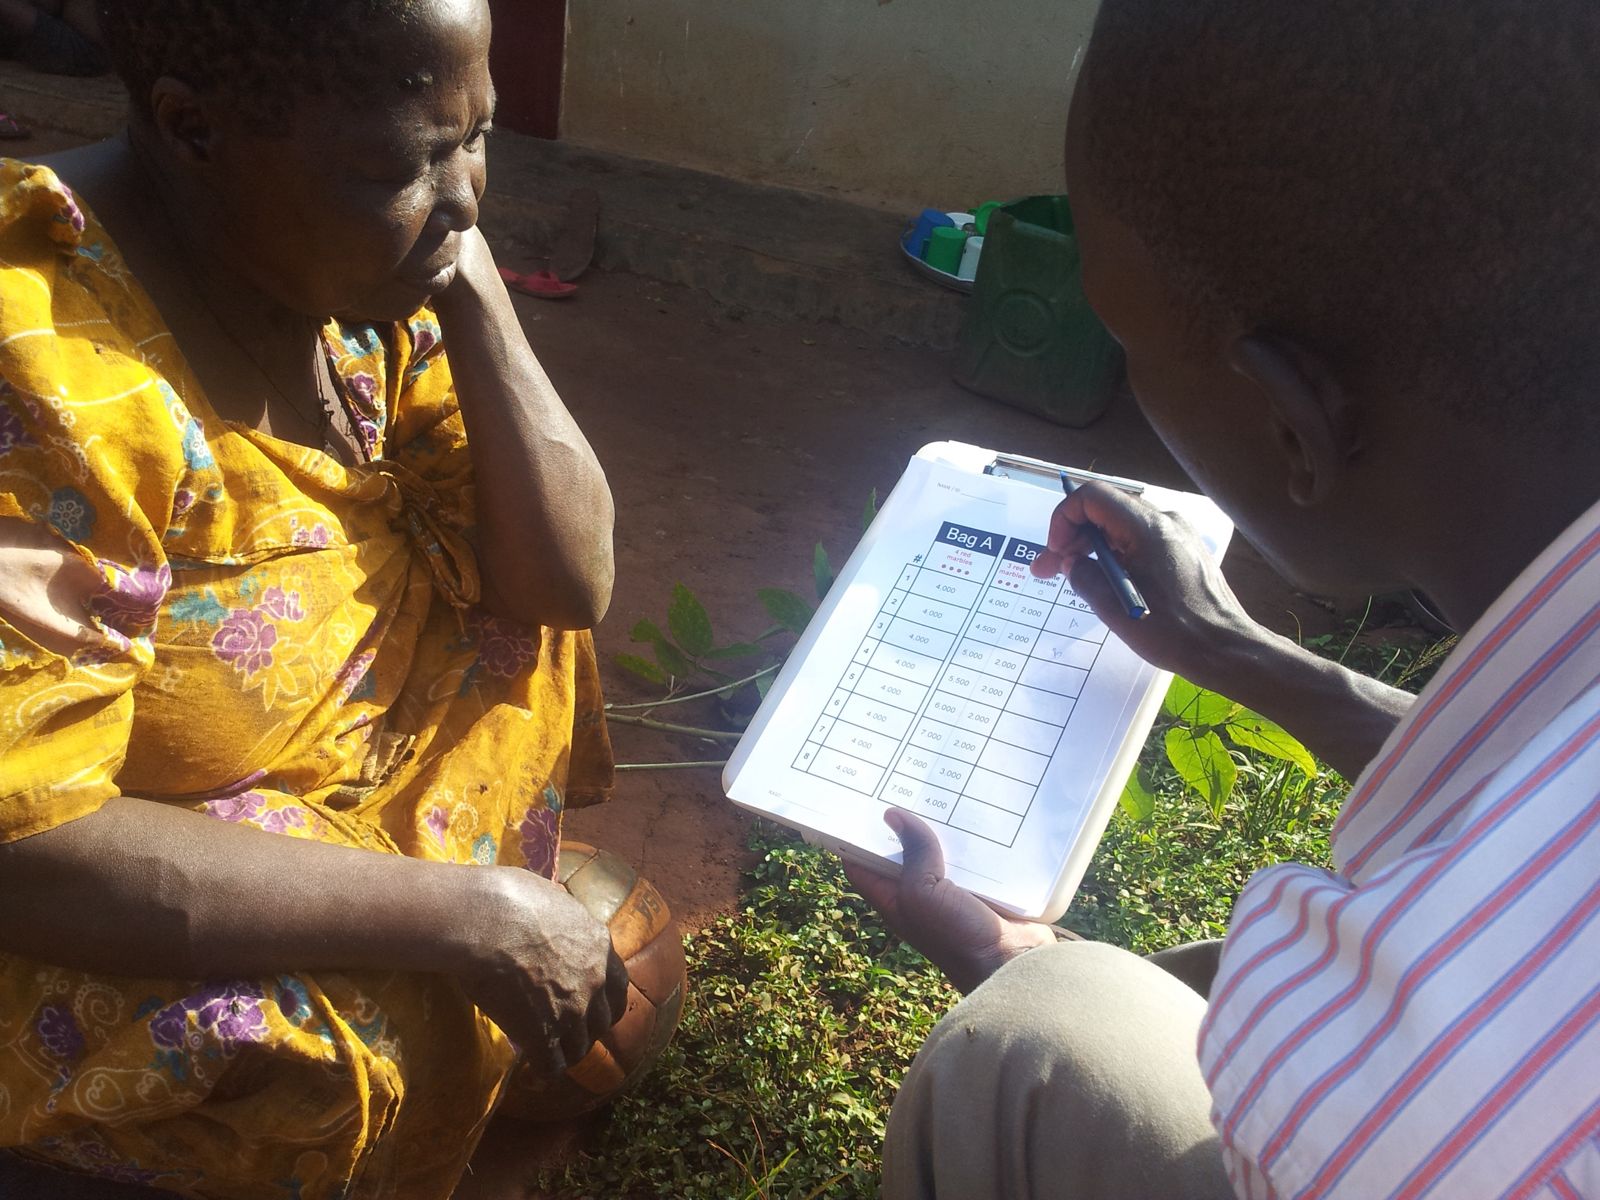
Bag A or Bag B, in the field
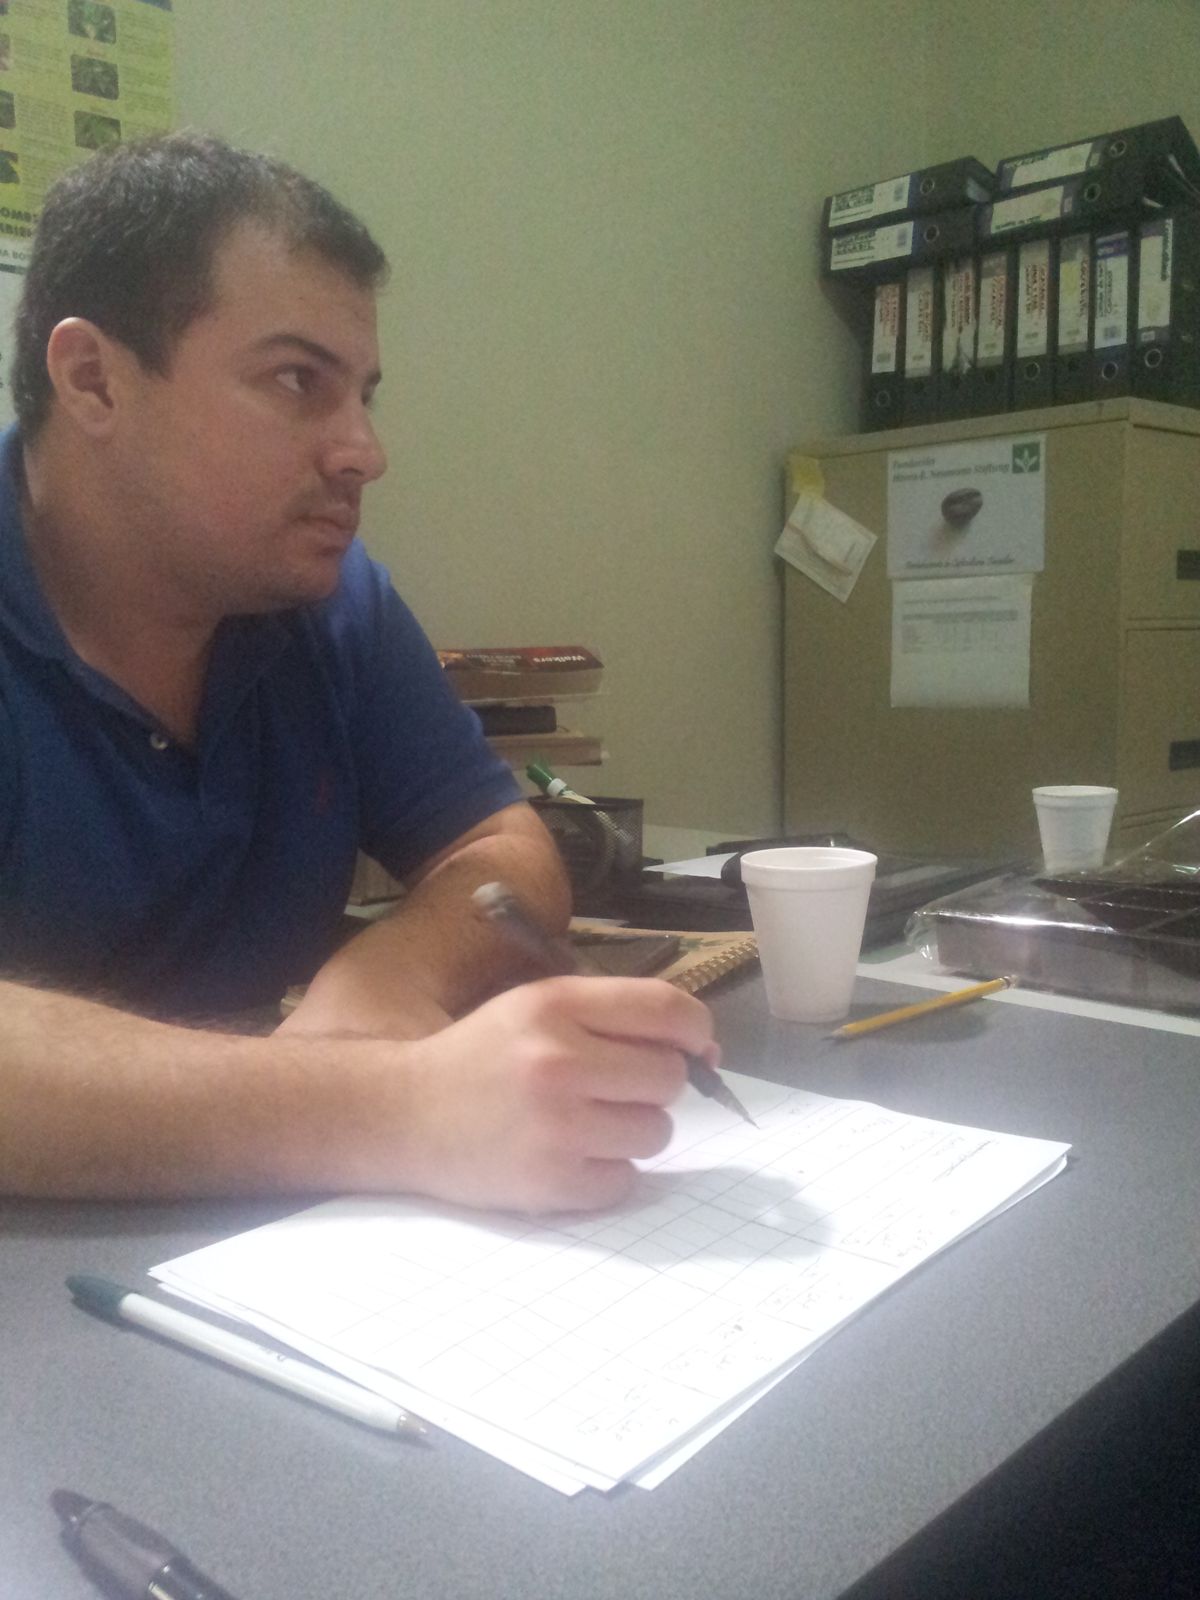
An enumerator talks a grower through the marble game's answer sheet at the end of a survey. Bag A pays 4,000 shillings whatever marble comes out. Down the sheet, Bag B's three red marbles rise from 4,000 to 7,000 and its white marble pays 2,000 until the last two rows, where it rises to 3,000 and then 4,000. The grower's choice for each row goes in the last column. You're about to fill in the same sheet.
Game 1 · Bag A or Bag B?
Before you startHow the enumerator explained it
Two bags, A and B, with four marbles in each, and you draw one. In Bag A all four marbles are red, and each is worth 4,000 shillings. In Bag B three marbles are red and one is white, and what they are worth changes on every row of the sheet. Choose a bag for each of the eight rows. When all eight are filled in, one row is picked at random and played for real.
Put in plain words from the instructions on the growers' answer sheet (thesis Appendix A.18, p. 377). 4,000 USh was about £1 at the time of the survey (Figure 46).
All eight rows are filled in. In the field, one row was then picked at random and paid in cash.
Growers in Buikwe and Kayunga were paid this way at the end of the survey, between 2,000 and 7,000 shillings. The draw is luck; it doesn't change your result.
| # | Bag A · 4 red marblesA · red | Bag B · 3 red marblesB · red | Bag B · 1 white marbleB · white | Pick A or B?Pick |
|---|---|---|---|---|
| Row randomly chosen: ____ · Paid: ____ | ||||
In the field, players were told they could not change their answers.
Percentages leave out inconsistent answers, as the thesis does: they are shares of 86 growers, 108 London adults and 67 traders.
Show the numbers
On average growers switched at row 3.97, London adults at 4.5 and traders at 5.00. Growers took Bag B significantly earlier than both, yet all three groups were somewhat risk-averse on average: each switched significantly later than the risk-neutral row 3.
The maths
With u(x) = x1−r/(1−r): r = 0 is risk-neutral, below 0 risk-loving, above 0 risk-averse (Table 46).
Thesis Figures 46 and 47 (pp. 225 to 226), Table 46 (p. 228), Figures 57, 59, 60 and 61 and the discussion (pp. 249 to 255), Appendix A.18 (p. 377).
Simplified for play: no money changes hands; after each pick you see what the real players chose (they didn't see each other's); and you can undo your last row, where in the field answers were final.
What the marble game found Opens when you finish, or open it now
Coffee growers are risk-takers
The largest group of growers who answered consistently, 35%, were very risk-loving. Growers switched to Bag B at row 3.97 on average, against row 4.5 for London adults, a significant difference. Coffee is a high-risk, high-reward crop, and the people who grow it seem to choose it for that. Traders were more cautious, at row 5.00.
Londoners were no more consistent
Ugandan growers answered consistently 72% of the time and London festival-goers 78%, a difference that was not statistically significant. Explaining the game took ten minutes in the field and a few in London, but the quality of answers was the same.
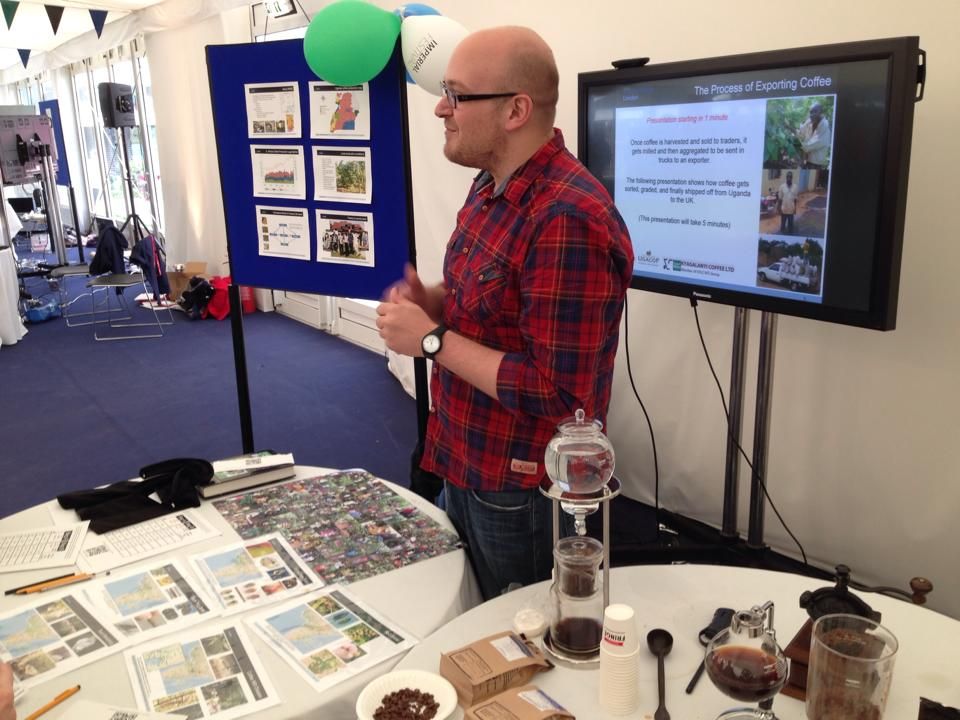
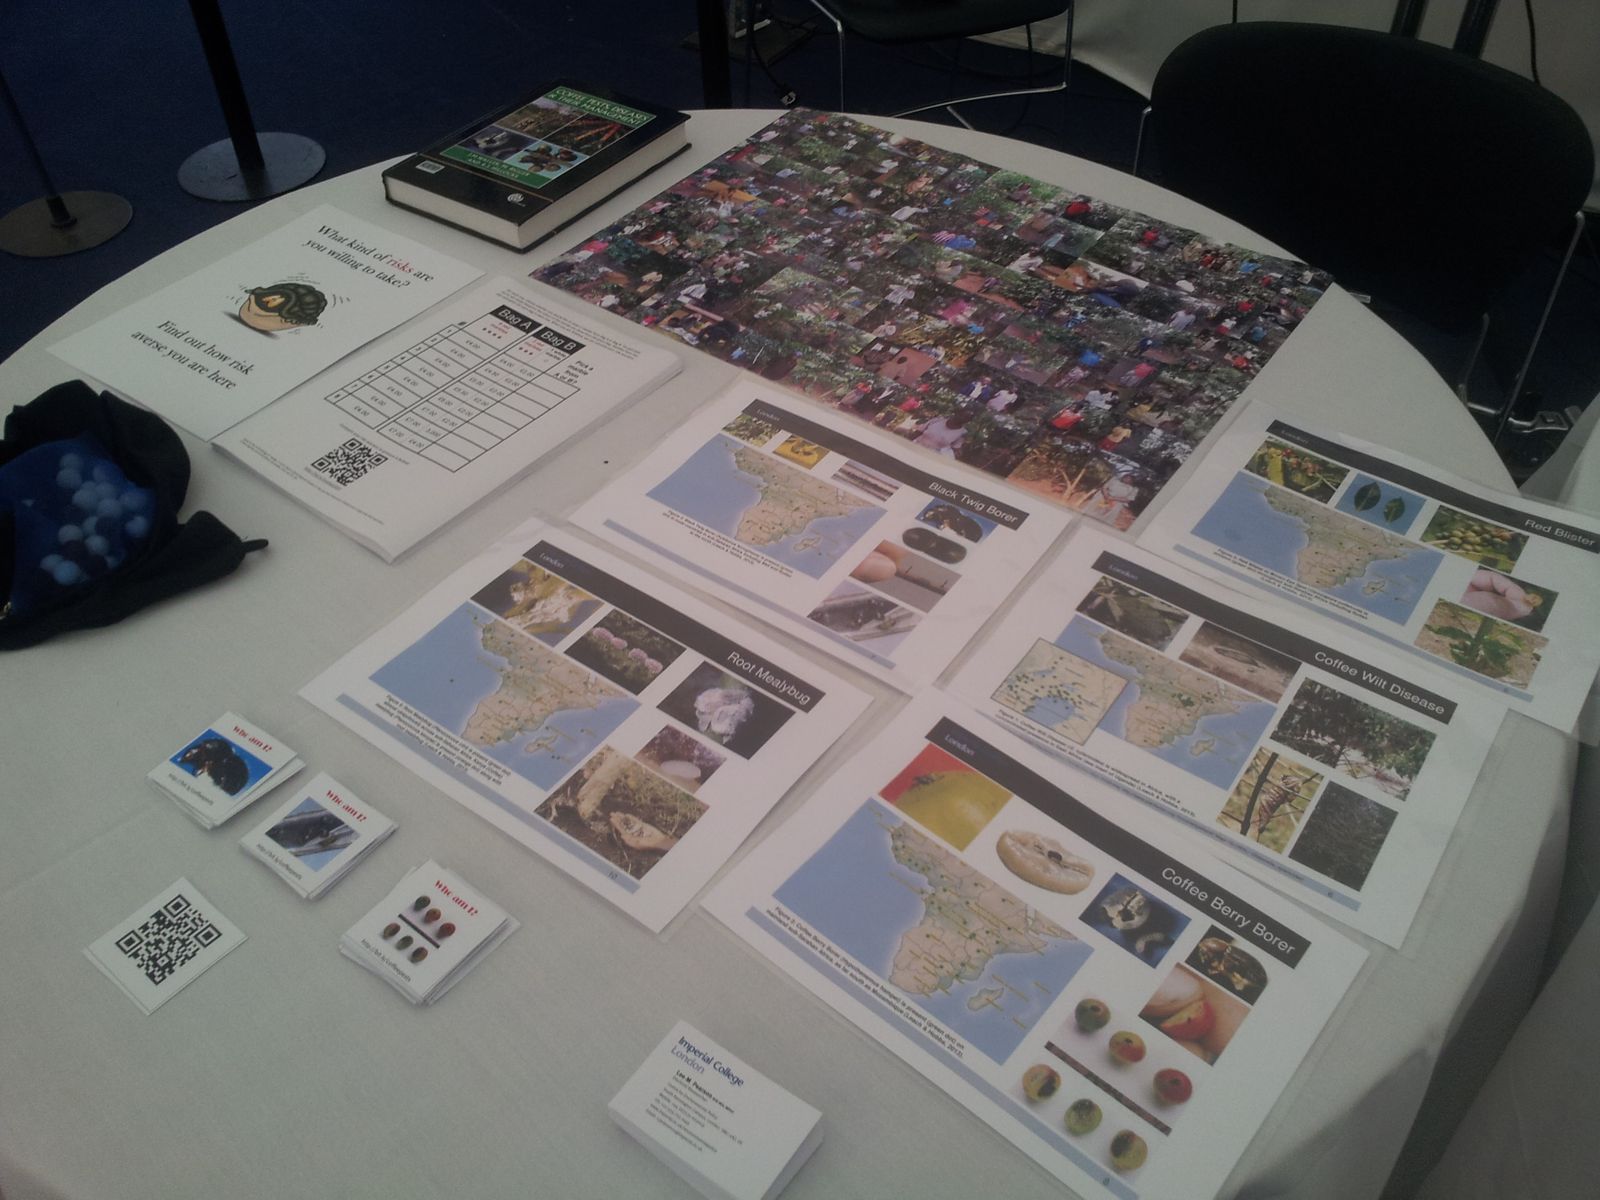
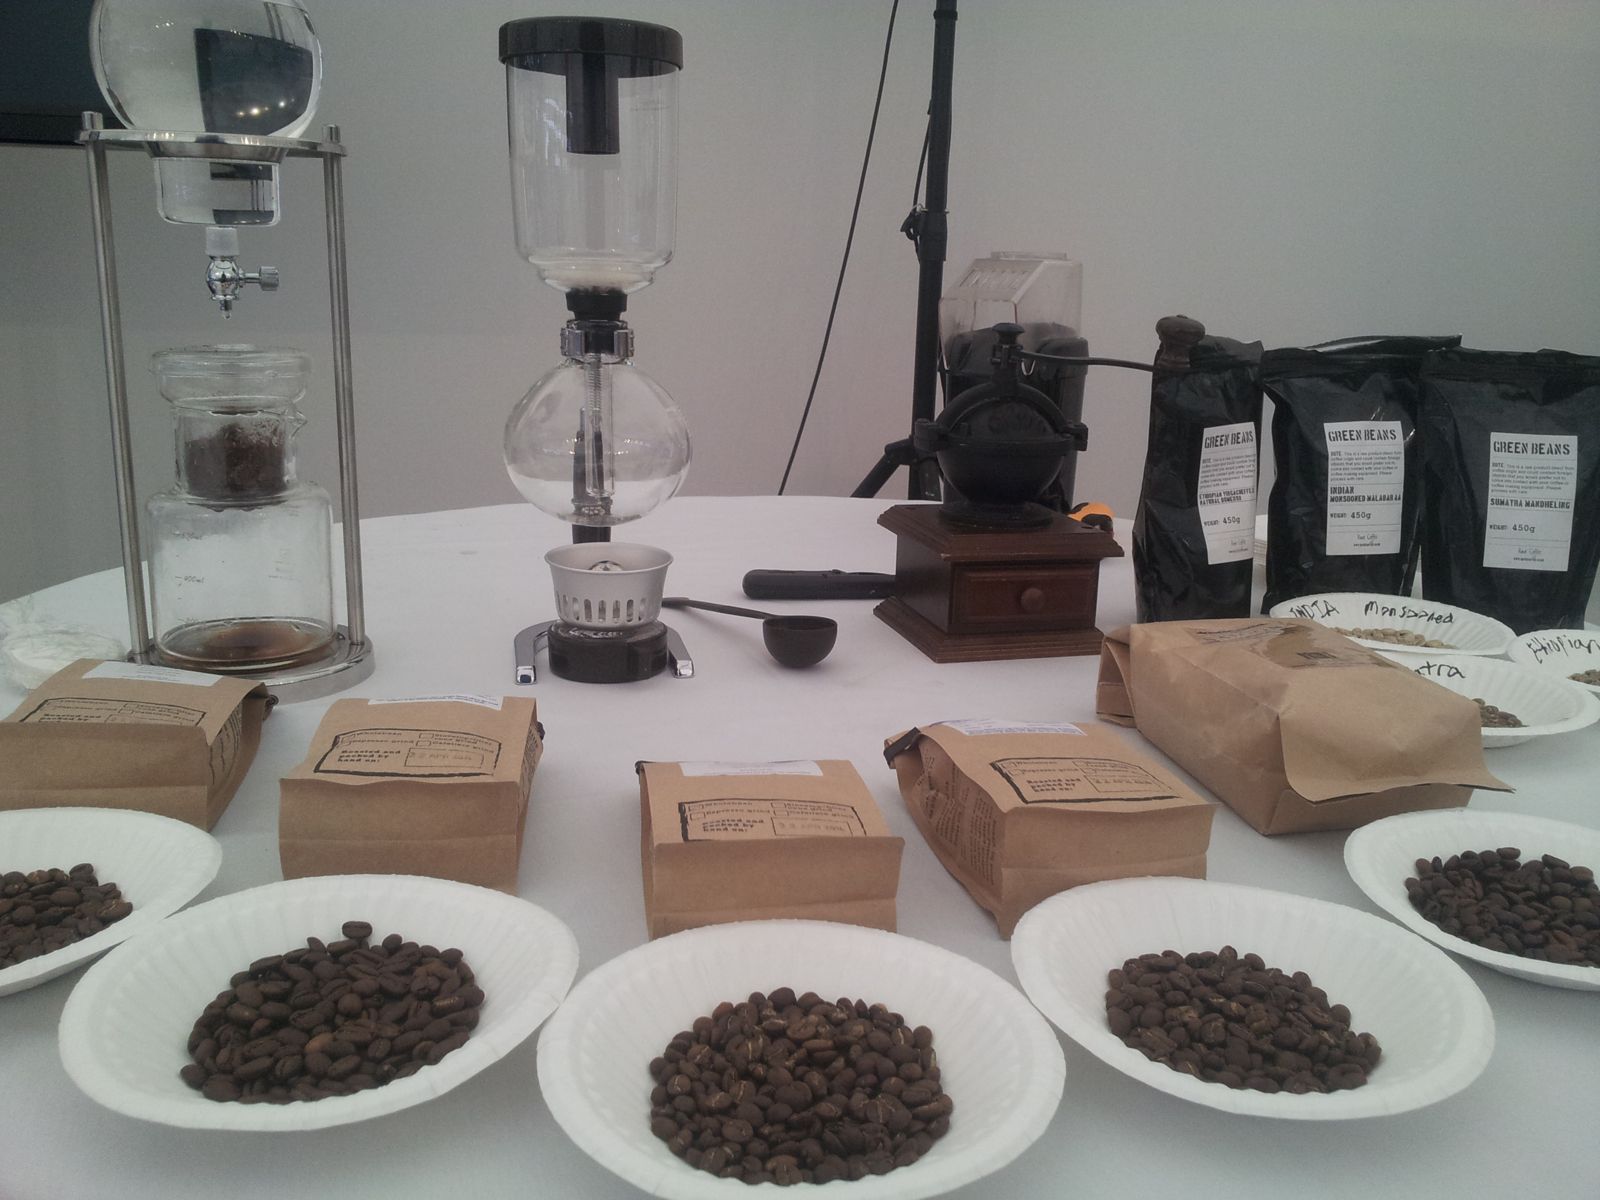
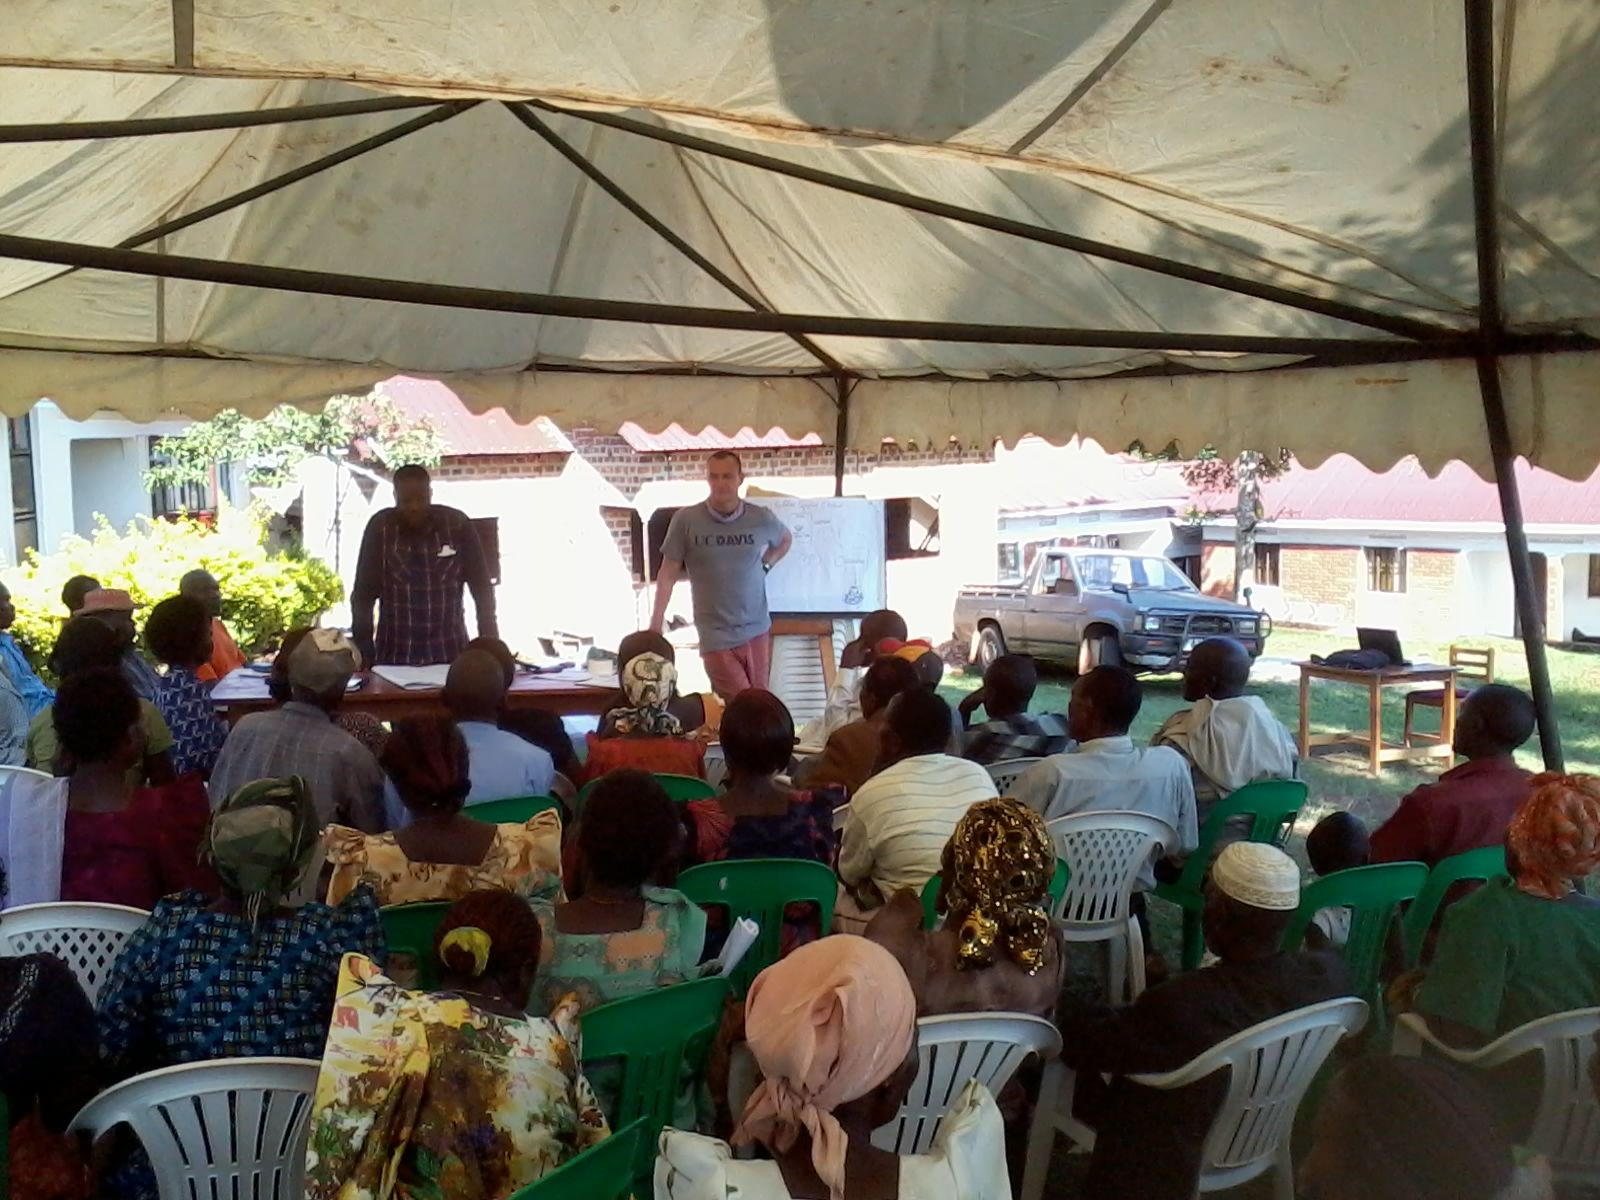
The crowd that played the market game
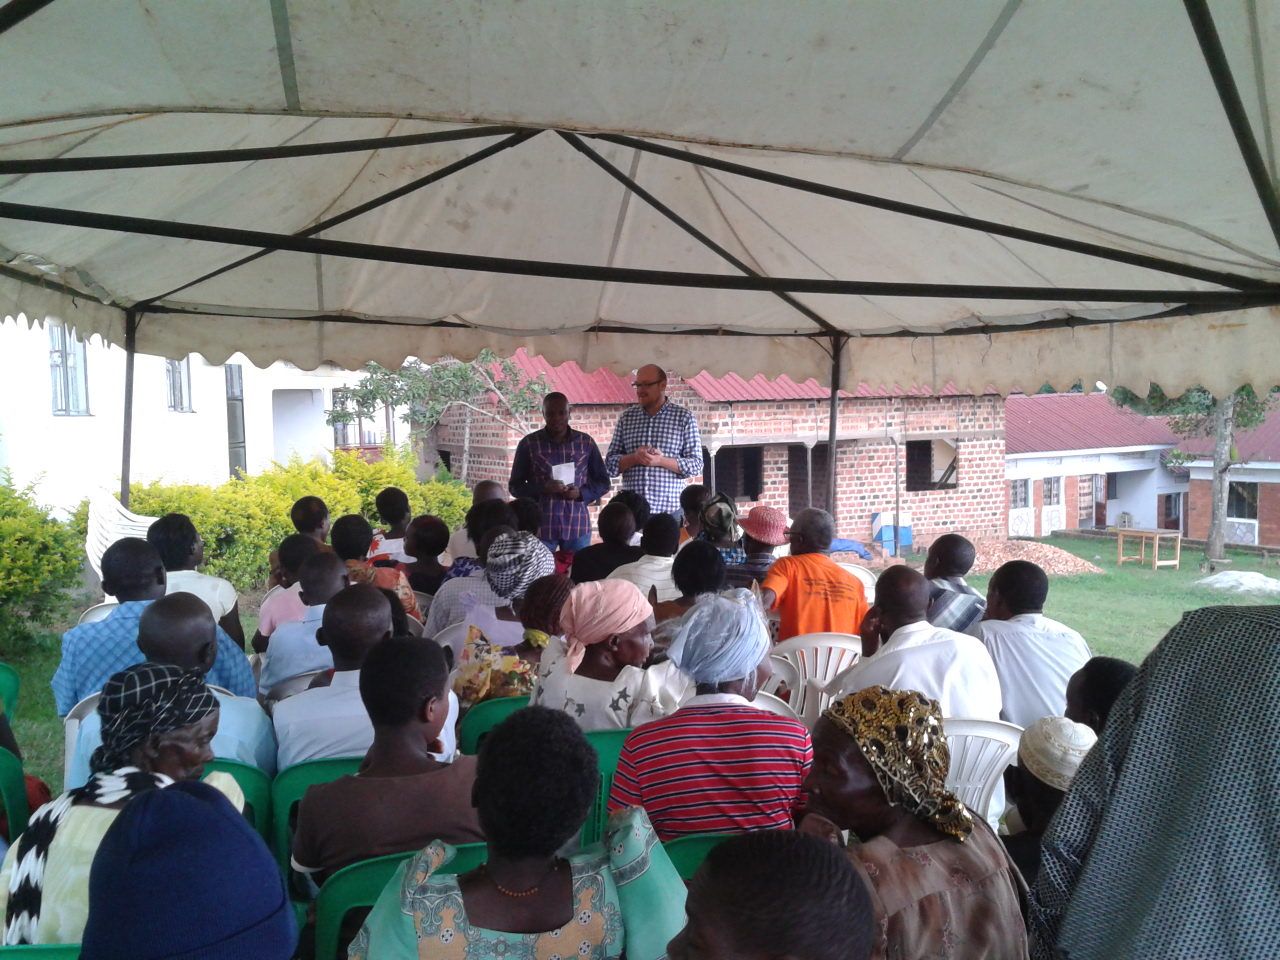
The RASD workshop tent at about four in the afternoon. The market game below was the day's last session, so this is the crowd that played it (the timing comes from the photo's timestamp).
Game 2 · The coffee market
How the game works
Nkokonjeru, 11 January 2014, half past four. Nearly 100 farmers and traders have spent the day in RASD's tent talking about markets and pests. The last session is a trading game. Six teams, who picked their own members, each have 100 kg of dried coffee (kiboko) to sell every season. A market maker with a laptop announces each season, and three researchers walk between the teams as Traders A, B and C, each with a translator.
Most money at the end wins. On the day, each member of the winning team took home 7,000 USh (about £1.75), more than a day's wage there. Ten seasons are planned; play until the market maker calls time.
Simplified for the web: you decide alone instead of arguing it out as a team; the traders' offers are the fixed prices from the thesis's design table, without the haggling; you move coffee in 25 kg sacks or 5 kg scoops; your sales use up stored coffee first; and takings are rounded to the nearest 1,000 USh for each trader each season, as in thesis Table 55, so you are ranked on the same terms as the teams. Times from the workshop agenda (thesis Appendix A.16): the game was explained at 4:30 pm and planned to end at 5:45.
Contract · Trader A · seasons 1 to 5
- 1,800 USh a kilo, every season
- Trader A buys at least 50 kg a season
- The other 50 kg you may sell to Trader B or C
- Sell Trader A less than 50 kg and Trader A will refuse to deal with you for the rest of the game
- You can sign now or after season 5, at no other time
Trader A will push you to sell all 100 kg, talking about good will, relationships and the company's volume targets. paraphrased from the thesis
Season board
The market maker calls time
Time's up in the tent. Teams spent far longer discussing strategy and bargaining with the traders than Lee had planned, so the game was cut short. Seasons 8 and 9 were never played.
On the design sheet they were a bad year and a horrible one: Trader B 1,260 and 1,260, Trader C 1,260 and 1,080 a kilo.
Coffee kept from season 7 can be sold in the last season, as Team 5's was.
Thesis Tables 45, 54 and 55 and Figure 67. Revenue in thousands of Ugandan shillings. The zero line is worked out from Table 45; in season 6 Trader A could only take 25 kg, so no team could actually sit on it. The thesis's method section (p. 223) says rounds 7 to 9 were cut, but its results tables and text (pp. 263 and 266) show season 7 was played, and this page follows the tables.
Show the numbers
How the game was built: over all ten planned seasons, selling everything to Trader A or everything to Trader C came out the same on average, and everything to Trader B came to 95% of that. Signing bought a steady price, not a better average one.
What the market game found Opens when you finish, or open it now
Nobody broke the contract first
Five of six teams sold to Trader A in every season, even when the open market paid more. No team broke the contract before Trader A did.
Then the trader broke it
In season 6 the researchers had Trader A buy only 25 kg and ask teams to hold the rest. Three teams waited and sold 175 kg the next year. Only one team walked away.
A case for price-stable cooperatives
Farmers valued a stable price and honoured it. A large cooperative could hedge on the London futures market, something no single farmer can do, and pass the stability on.
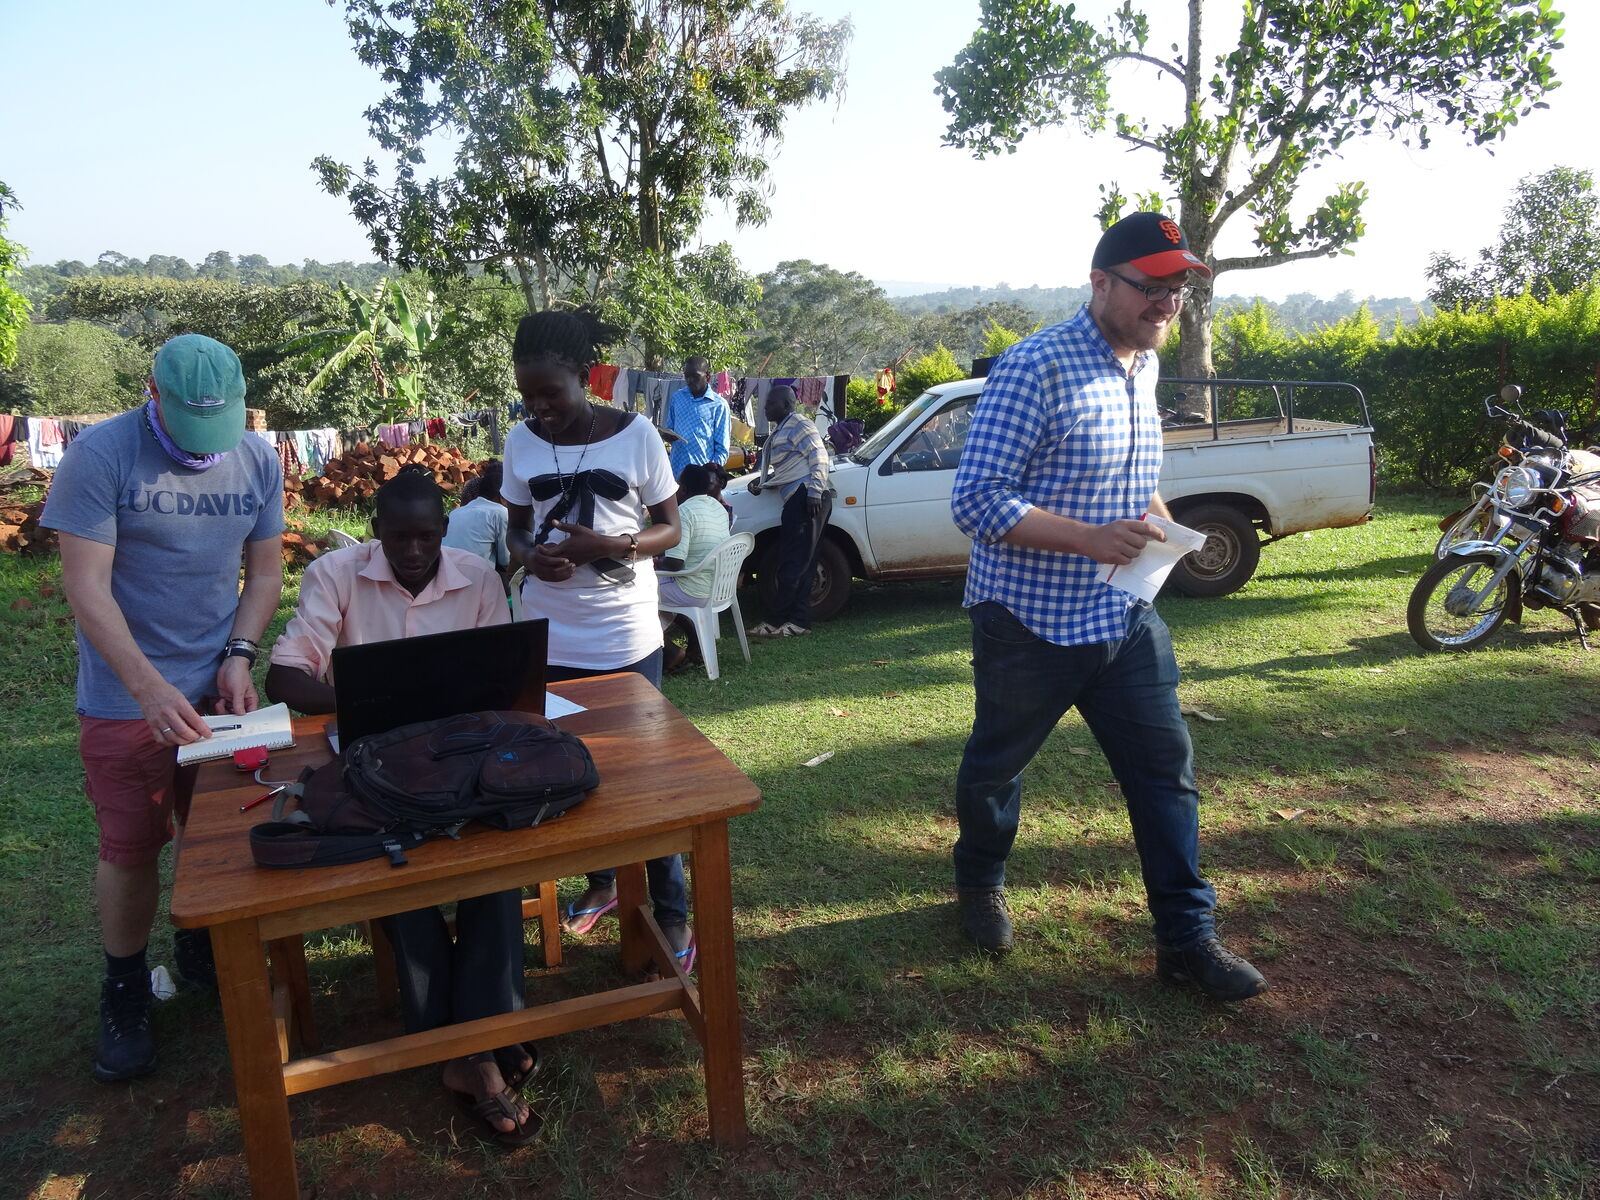
The market game, as it was played
Late afternoon on the lawn beside the RASD workshop tent. The market maker's laptop is on the table; at the end of each season the traders reported every team's sales to the market maker. Lee, one of the three traders, walks past with his price sheet. Behind, teams sat in circles of plastic chairs to argue out each season's choice while the traders and their translators went from team to team to buy.
How the game was run: thesis pp. 221 to 223 (Figures 44 and 45).
Growers in Buikwe and Kayunga took the chance bag earlier than London visitors and traders; in the Nkokonjeru tent, farmers and traders still kept a steady-price contract when the open market paid more. The thesis's reading: coffee growers live with high risk for high reward, and still value a stable price when someone offers one.
Photos were taken with the consent of the people taking part in the research, who were paid for their time through the risk game. At the Nkokonjeru workshop, everyone was given lunch and the winning market-game team a cash prize (thesis pp. 164 and 222).
A year in Canberra that built the dataset
Lee was awarded the inaugural Fulbright ANU College of Business and Economics Postgraduate Scholarship. Working with economist Dr. Emma Aisbett, his advisor at ANU, Lee built a database of the rules that protect human, animal and plant health in the food trade (sanitary and phytosanitary, or SPS, measures) that WTO members notified from 1996 to 2010, product by product, and merged it with tariffs, trade, governance and environmental data. It became Chapter 2 of the PhD and a joint working paper.
Getting there: Beijing to Angkor overland
Lee left Silwood Park with a rucksack on 6 March 2011, flew from London to Beijing and went on by train and bus through China, Vietnam and Cambodia to the temples of Angkor. Time was running short and the border between Cambodia and Thailand was not safe to cross then, so Lee flew from Siem Reap to Kuala Lumpur on 1 April, went on to Melaka and Singapore, and reached Sydney on 9 April and Canberra the next day.
- 6 MarEnglandSilwood Park, Ascot · flight from London
- 7 to 16 MarChinaBeijing 7 to 10 · night train to Guilin and Yangshuo 11 to 16 · Nanning 16
- 17 to 28 MarVietnamAcross the border on foot 17 · Halong Bay and Cat Ba 17 to 20 · Hanoi 20 to 21 · Hue 22 · Hoi An 23 to 24 · Da Lat 25 to 26 · Ho Chi Minh City 27 to 28
- 28 Mar to 1 AprCambodiaPhnom Penh 28 to 29 · Siem Reap and Angkor 29 Mar to 1 Apr · flight to Kuala Lumpur
- 1 to 8 AprMalaysia and SingaporeKuala Lumpur 1 to 4 · Melaka 4 to 6 · Singapore 7 to 8 · flight to Sydney
- 9 to 10 AprAustraliaSydney 9 to 10 · Canberra 10
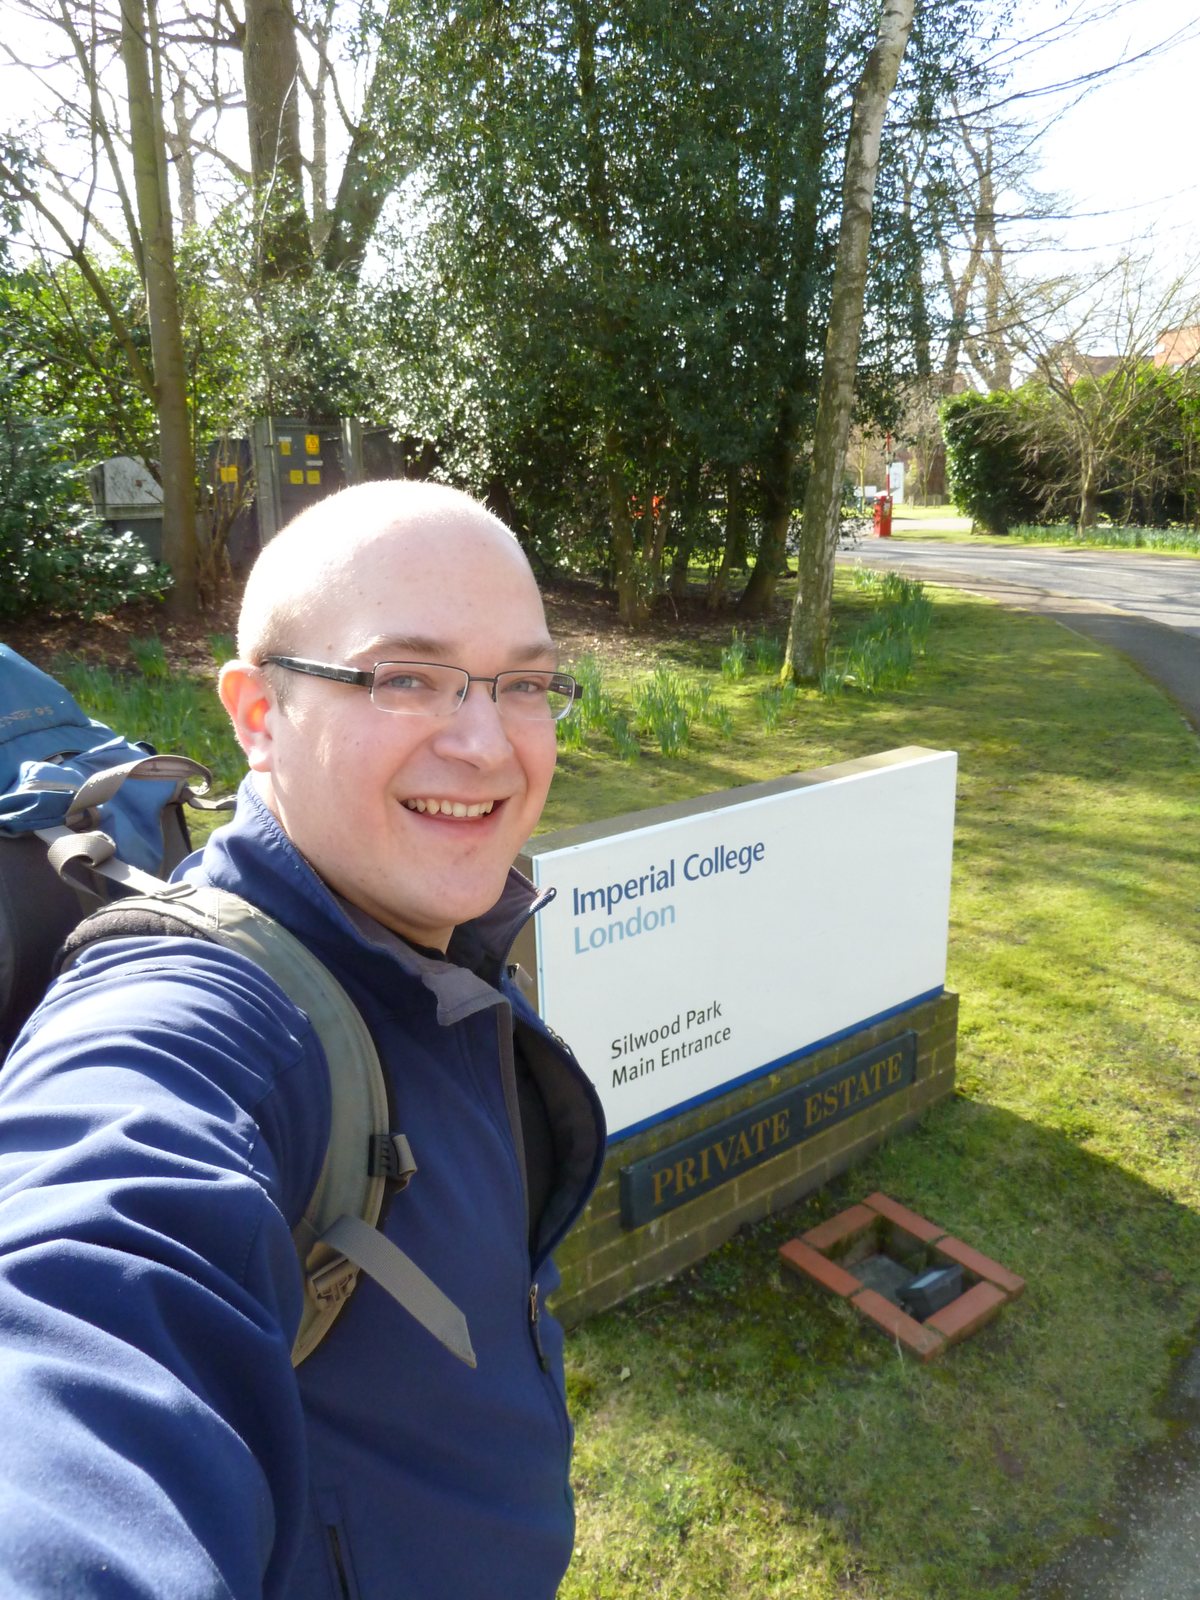
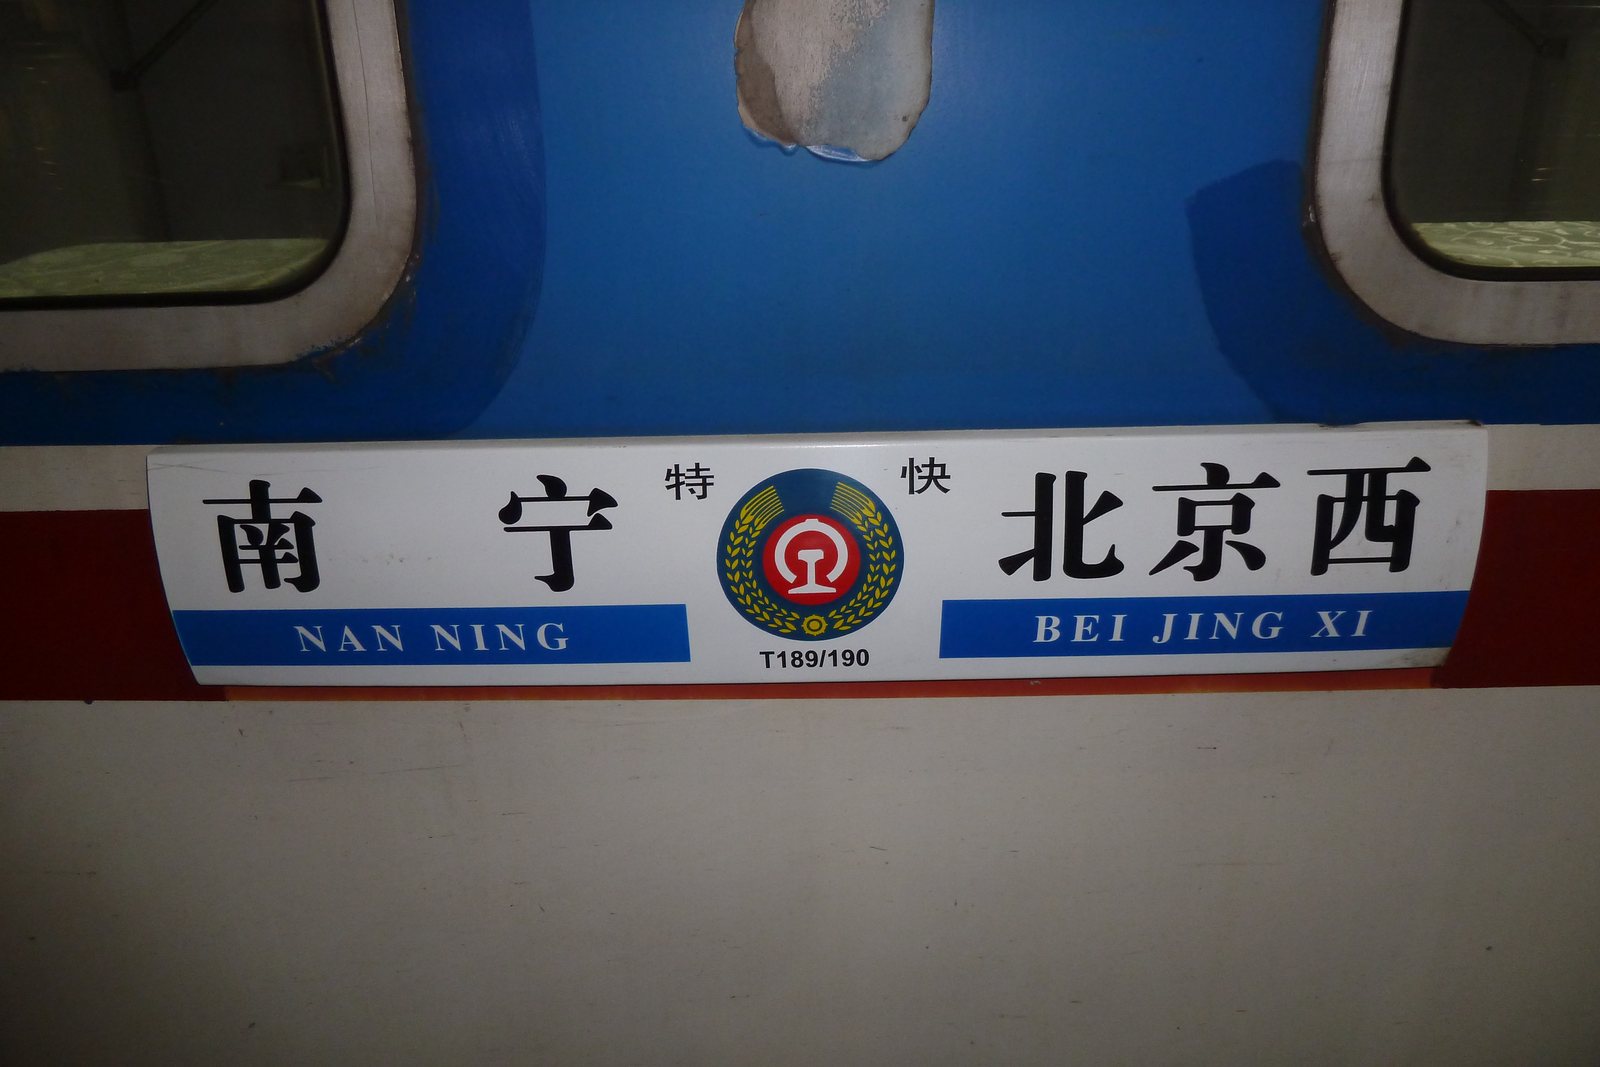
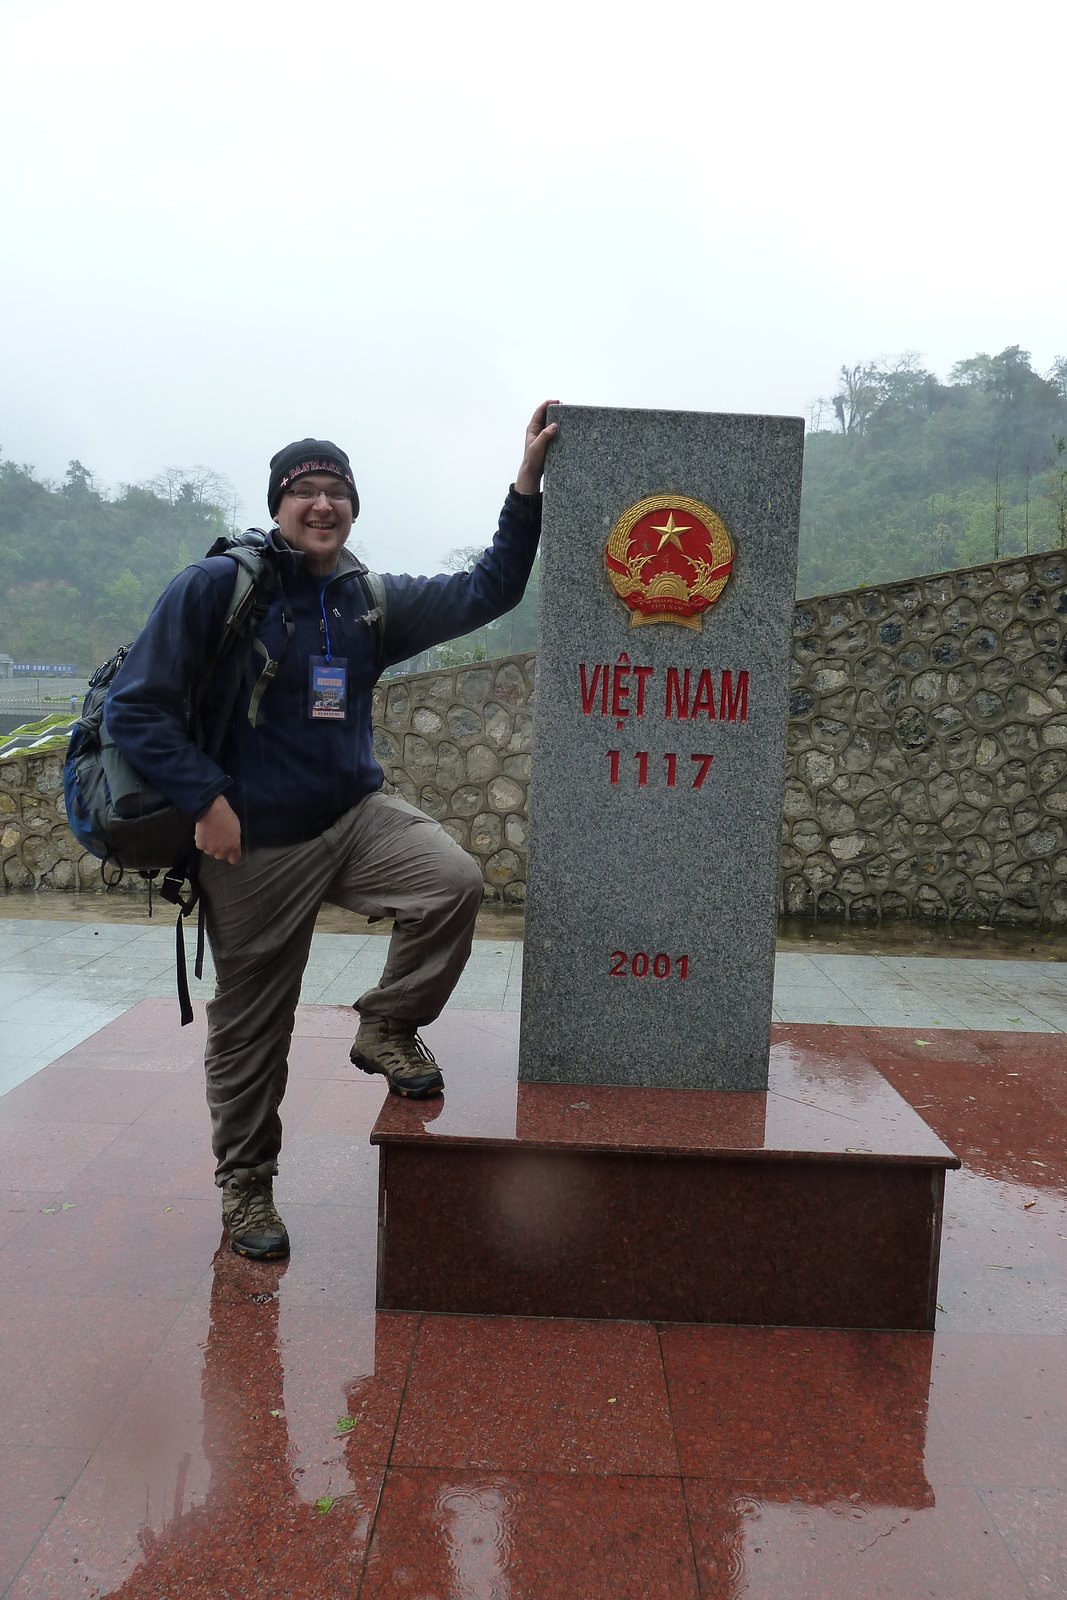
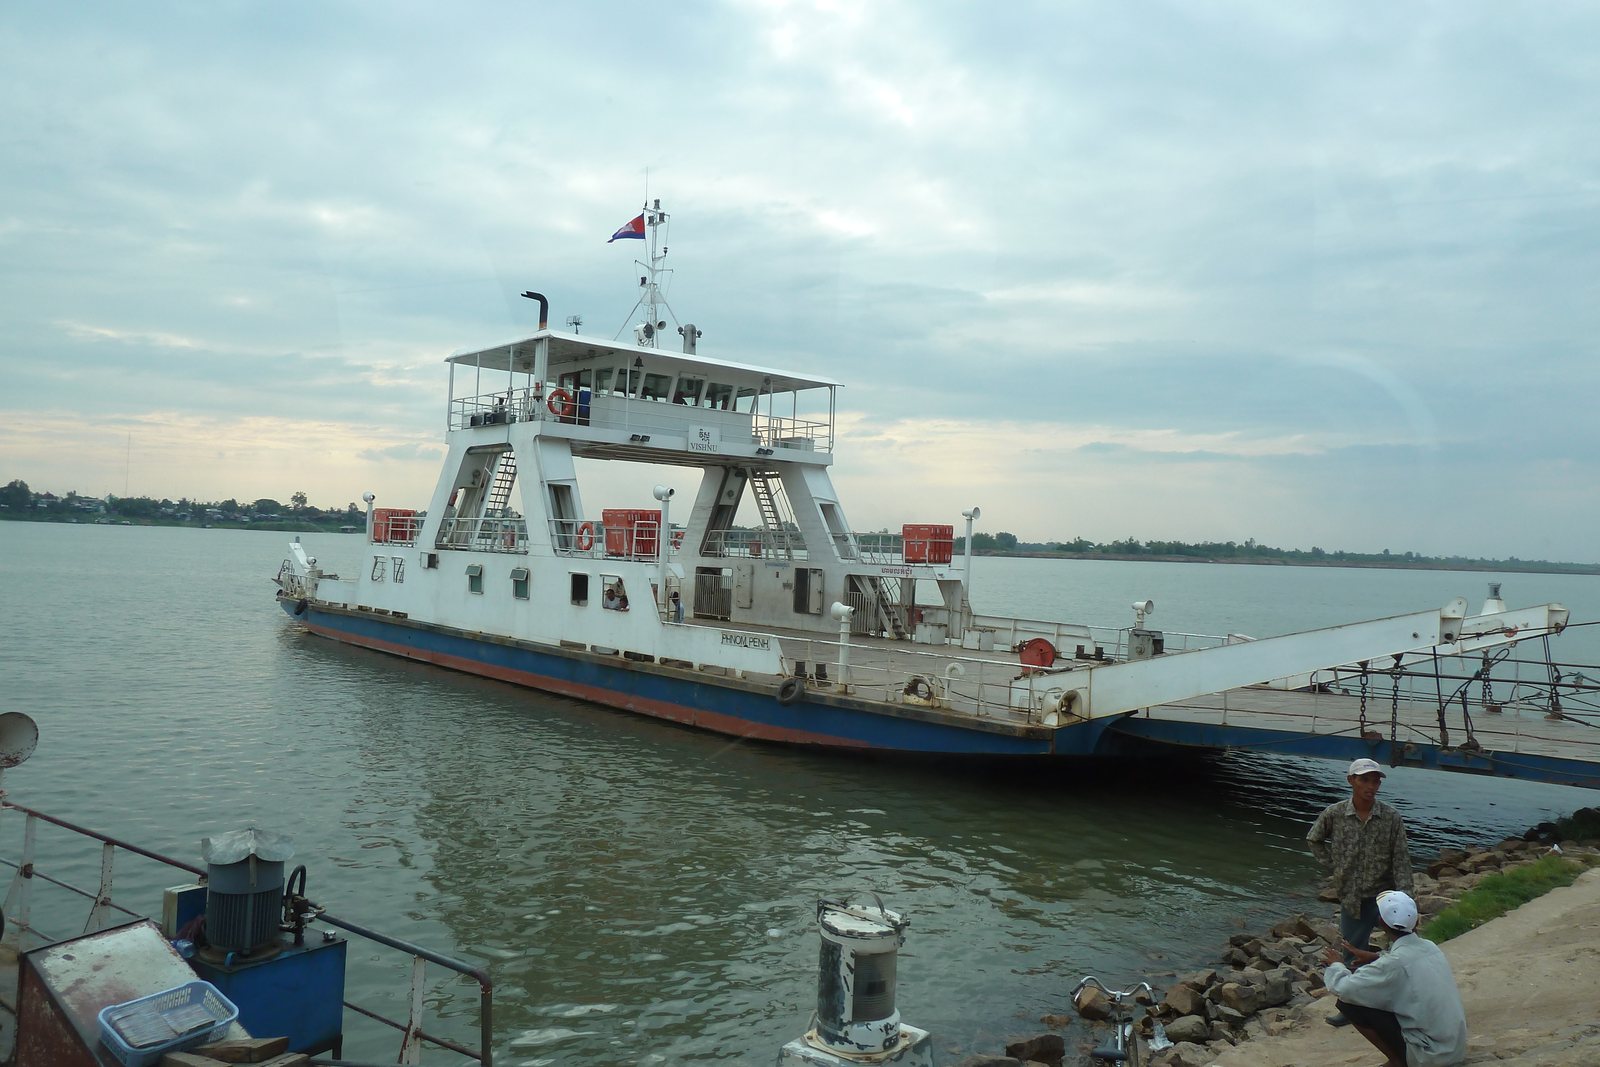
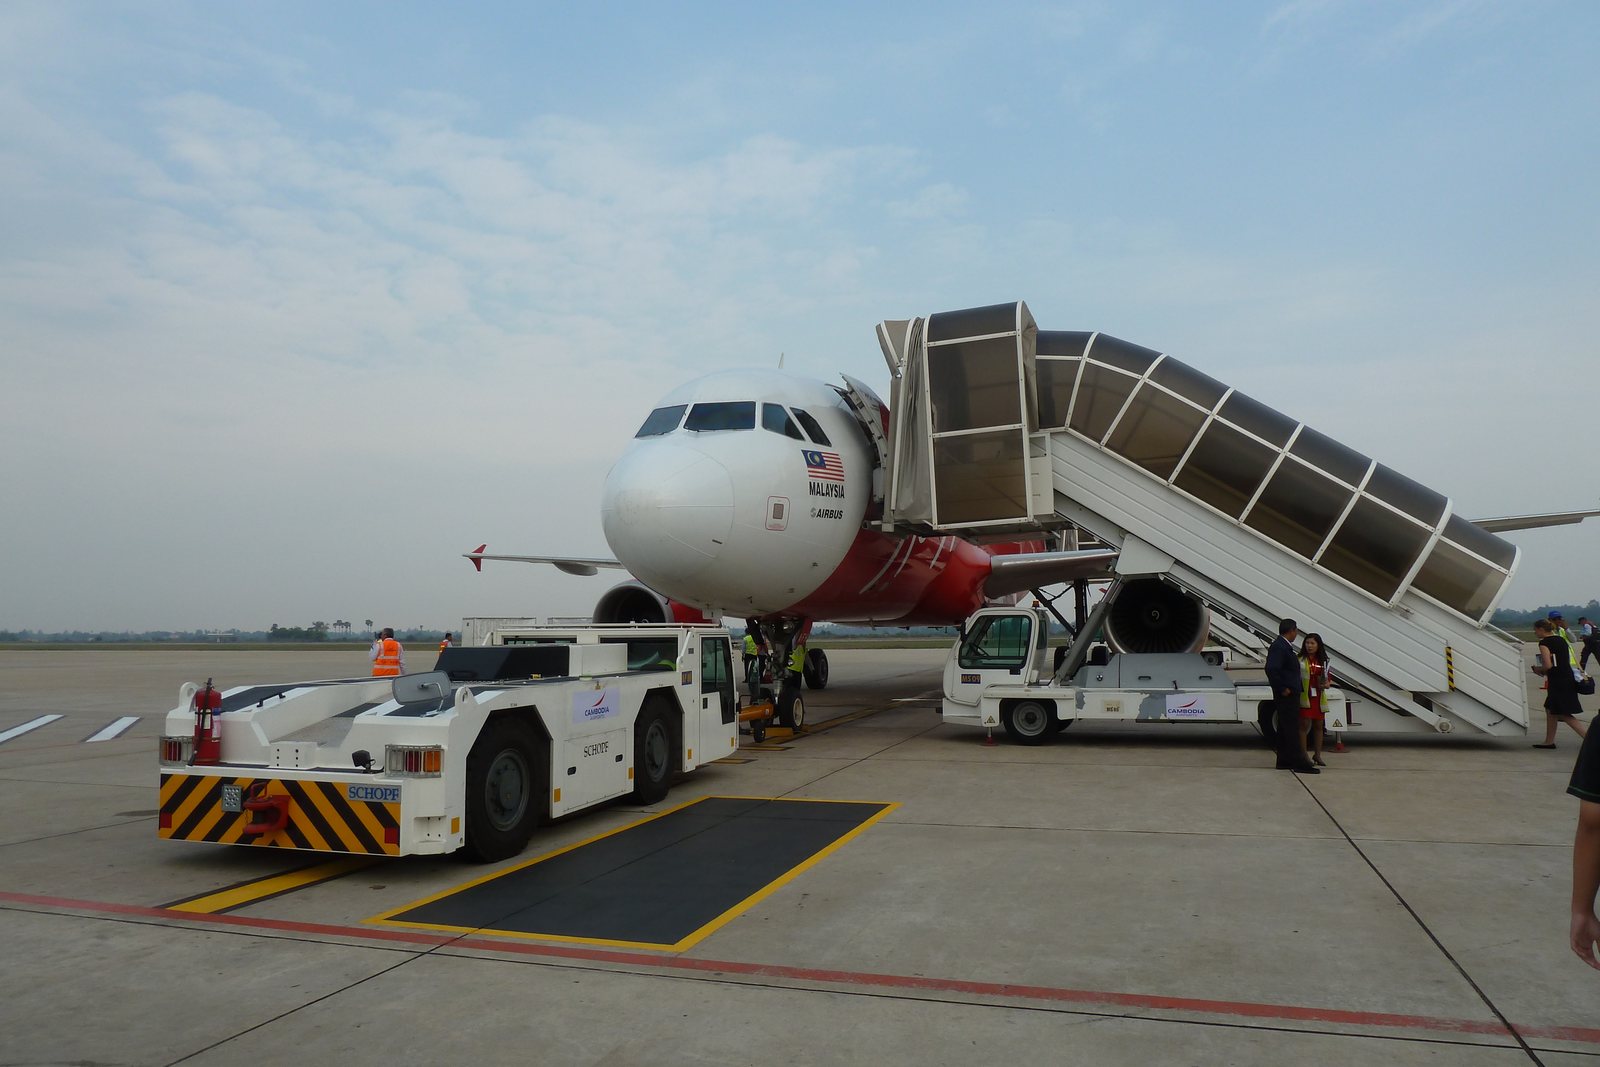
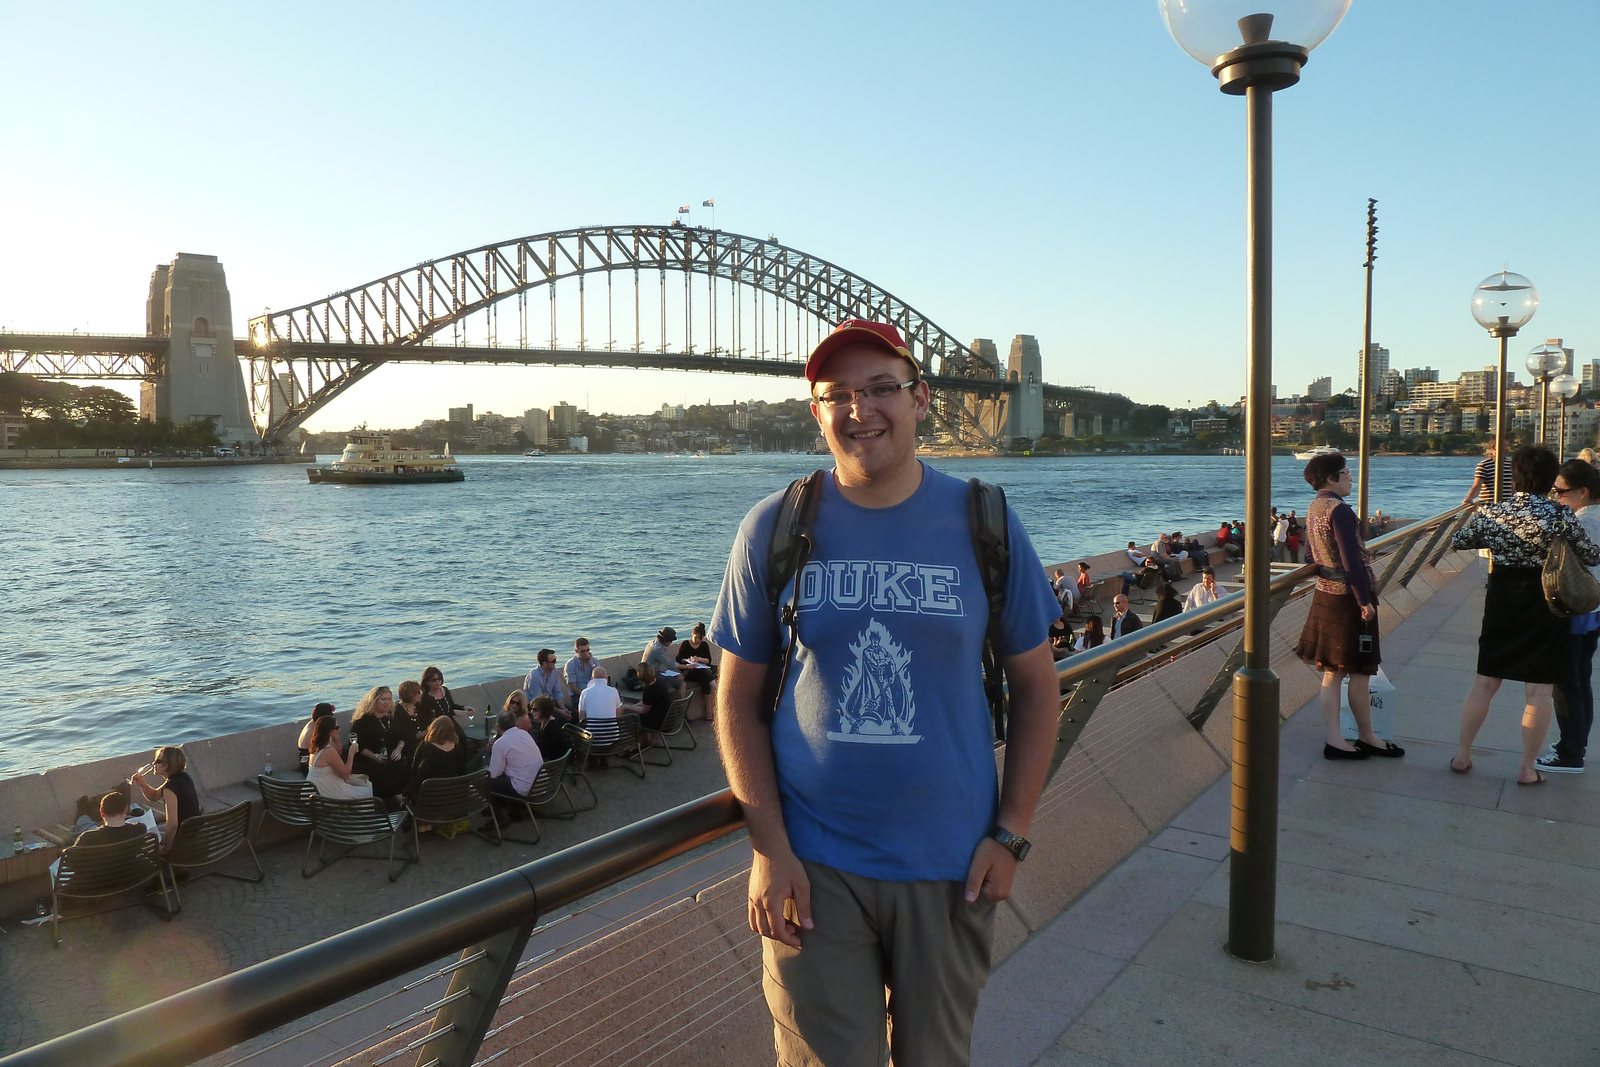
Lee's photos of the trip, dated by the camera's clock, which stayed on UK time all month; local dates and times are worked out from it. Legs with no photo of the transport (Hanoi to Hue, Hue to Hoi An, Da Lat to Ho Chi Minh City, Kuala Lumpur to Melaka, Melaka to Singapore, Sydney to Canberra) are dated from the last and first photos either side. The reasons for the flight from Siem Reap are Lee's own account.
Lee's speech at the ambassador's residence
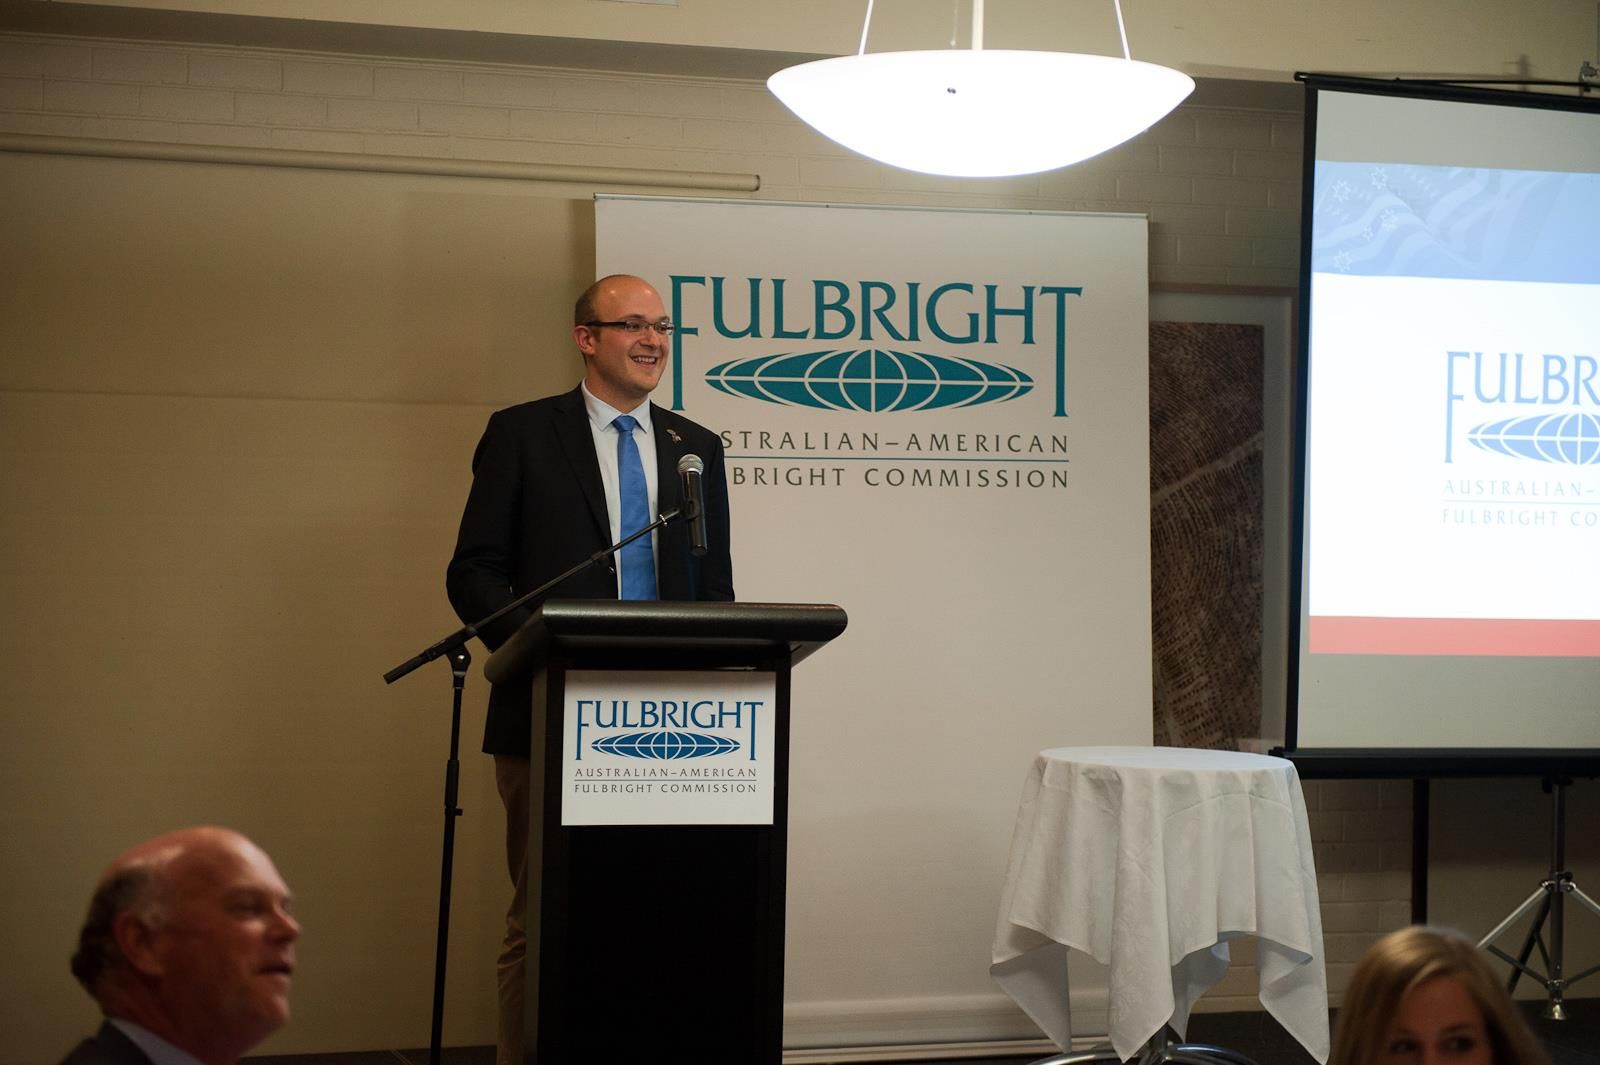
During the Fulbright year, Lee gave this speech at the ambassador's residence in Canberra.
From apples to a wider question
In his Fulbright reports, Lee gave his plan as "to develop a bioeconomic model to predict the impact from the import of US apples" into Australia, a country "notorious, in public opinion at least, for its strict quarantine policies". When the key contact for that model pulled out, recruited to make the government's official decision on the policy, Lee made only "more limited progress on the study of apples". Meeting "at least once per week", Lee and Emma Aisbett turned to a wider question: were countries using health rules for "risk protection" or as a "protectionist instrument"?
"I had been involved in volunteer work with an NGO in Uganda that wanted to export coffee… I was interested in looking at the drivers behind the growth of quarantine barriers and protections for human, animal or plant health in international trade."Lee Pearson, Fulbright final report, 2012
98 countries × 69 product groups × 15 years
- Regular and emergency SPS notifications that name a product, 1996 to 2010, from the WTO SPS Information Management System
- Bound and applied tariffs from TRAINS, via WITS
- Trade flows from UN COMTRADE
- Democracy (Polity IV), regulatory quality (World Bank Worldwide Governance Indicators), environment (Yale Environmental Performance Index and Environmental Sustainability Index), income (World Development Indicators) and ageing (UN World Population Prospects)
- Added in 2014 for the second paper: election timing from the Database of Political Institutions
"Environmental and Health Protections, or new Protectionism? Determinants of SPS Notifications by WTO Members"
Emma Aisbett and Lee Pearson. Crawford School Research Paper 12-13, Australian National University, December 2012. Submitted to the Journal of International Economics in January 2013.
"…decreases in bound tariff rates increase the probability of new SPS measures… the impact of tariff constraint on SPS notifications is minor compared to that of demographic, governance and environmental variables."
In plain words: tariff cuts did bring a few more health rules, but democracy, an ageing population and good regulation mattered far more. "The very strong link between democracy and SPS use is particularly noteworthy."
The picture the paper set out to test
Counted the paper's way, notices of new or changed SPS rules rose from 185 in 1996 to a peak of 840 in 2008, while the median tariff drifted down. "Many commentators have drawn a causal link between these two phenomena, but there have been few attempts to empirically test this claim." The paper was candid about this chart: "At this aggregated level, few definitive conclusions can be drawn." Its answer came from the country-by-product data above.
The paper's Figure 1, redrawn. Counted as in the paper: a notice covering two product groups counts once for each, and EU notices count once as reported. Totals 1996 to 2010: 5,928 regular and 2,559 emergency, 8,487 in all. Tariff: the median, across countries and product groups, of the trade-weighted average tariff. Recomputed from Lee's September 2012 Stata panel with the paper's own code; the bound version matches Figure 1 as shown at the Banff conference in June 2013, and the applied version is the chart Lee and Emma showed in 2012. Source data: WTO SPS Information Management System; tariffs from TRAINS via WITS.
How the data was gathered
There was no ready-made table of SPS notifications to download. Between June and August 2011 Lee exported them from the WTO's SPS Information Management System one product chapter at a time, 97 chapters of regular notices and 97 of emergency ones, and merged them with tariffs, trade and governance data in Stata. In the Stata code behind the 2012 paper, the sections marked as Lee's produce the opening figures, the summary statistics and the environmental results, and Emma's the main results. Lee later recorded the method in two videos for other researchers.
Taking it on the road
"With my advisor, we have finished a paper analyzing the drivers of quarantine (SPS) policy use in the WTO. I will present the results from my Fulbright work at an international trade and investment conference at Keio University in Tokyo in March 2012."Lee Pearson, Fulbright final report, 2012
The first paper was presented at nine venues in 15 months: by Lee in Tokyo, London, Famagusta and Leuven and at the WTO in Geneva, and by Emma Aisbett in Kiel, Melbourne and Banff. The slides don't record who gave the ANU seminar.
Lee's PhD thesis, section 1.4, and the dated slide decks for each talk.
"Trade liberalization and product standards for health and environmental protection"
The Fulbright data fed a second joint paper, drafted from September 2013, with Emma Aisbett by then at the University of Hamburg. It added a political economy model of how governments set standards when producers hate losses, and tested it on the SPS notifications. The finding answered both sides of the trade debate: after tariff cuts, countries with low standards showed signs of regulatory chill, holding their standards down, while countries with high standards raced to the top. Lee's thesis records that it "has been submitted to The Economic Journal of the Royal Economic Society", and the authors kept revising it until January 2017, by which time the chill looked the stronger of the two.
Source: Aisbett and Pearson's draft of 21 May 2014, which thanks Pramila Crivelli, Bob Gregory, Larry Karp, Carol McAusland and Martin Richardson for comments, and their draft of 6 January 2017, retitled "The impact of tariff liberalisation on standards for health, safety and environmental protection"; Lee's PhD thesis, section 1.4.
Thursday mornings at the arboretum
Outside the office, Lee joined the volunteers of STEP, the Southern Tablelands Ecosystems Park, planting one of the hundred forests of Canberra's new National Arboretum: laying trails, spreading mulch, weeding and measuring young eucalypts. Lee later stayed with an older couple from the group.
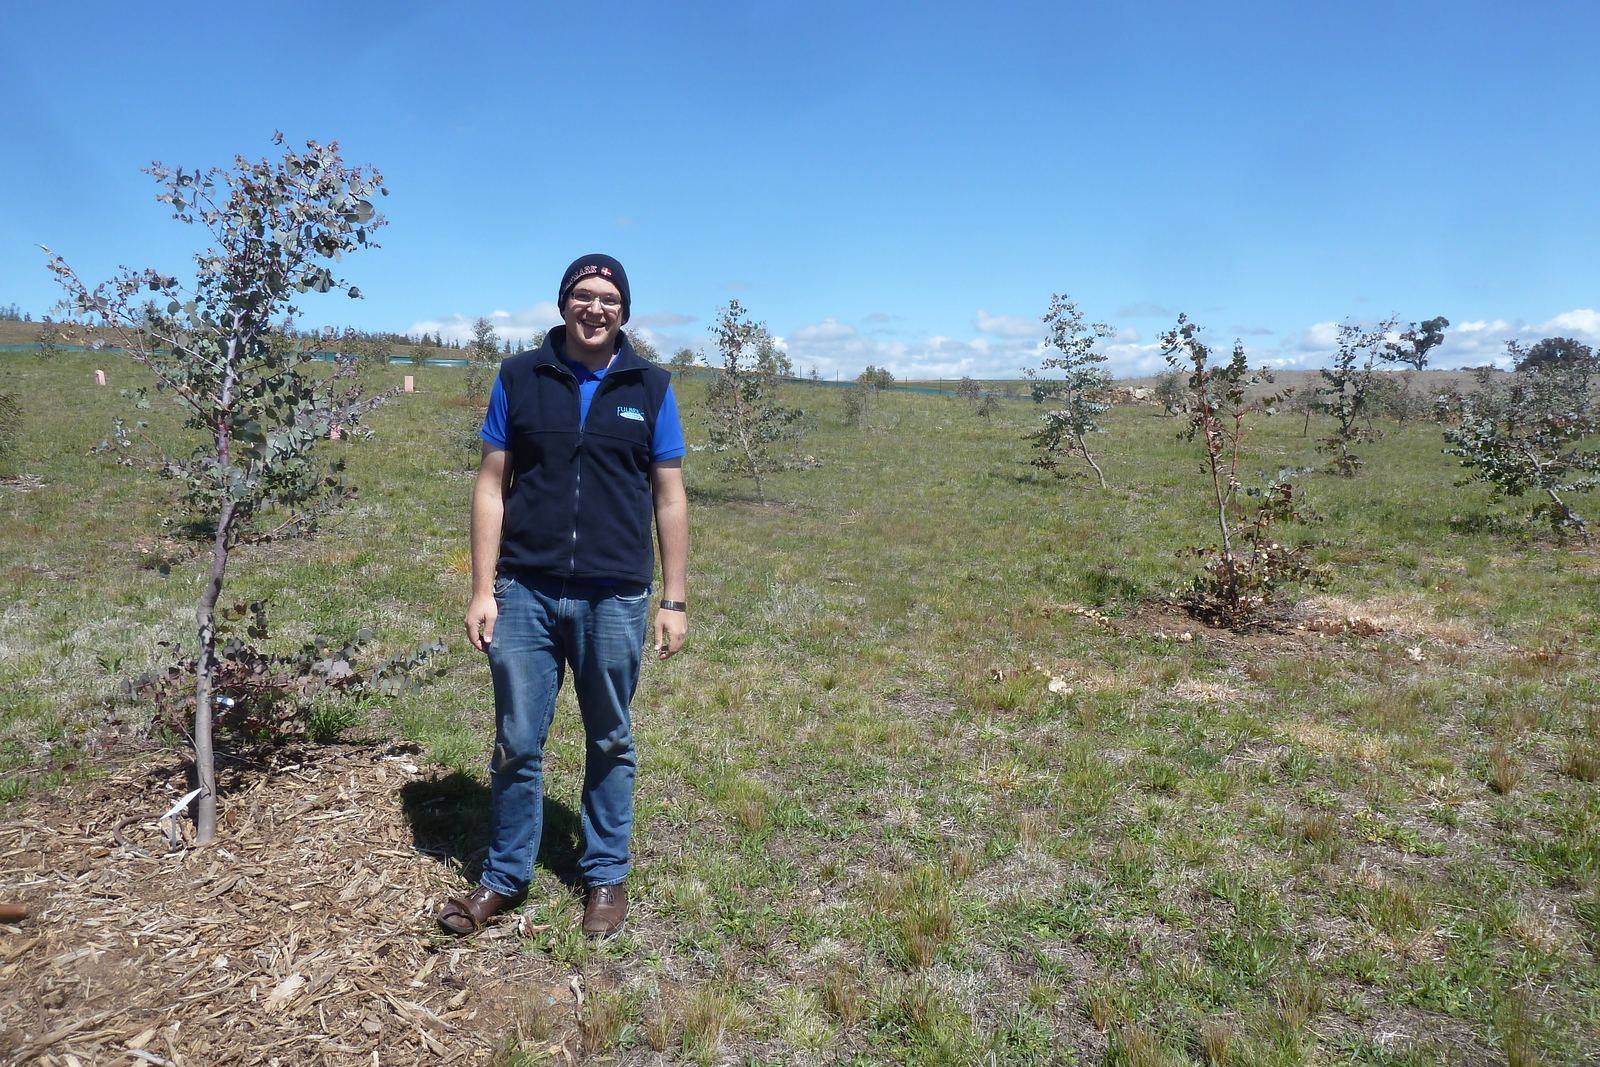
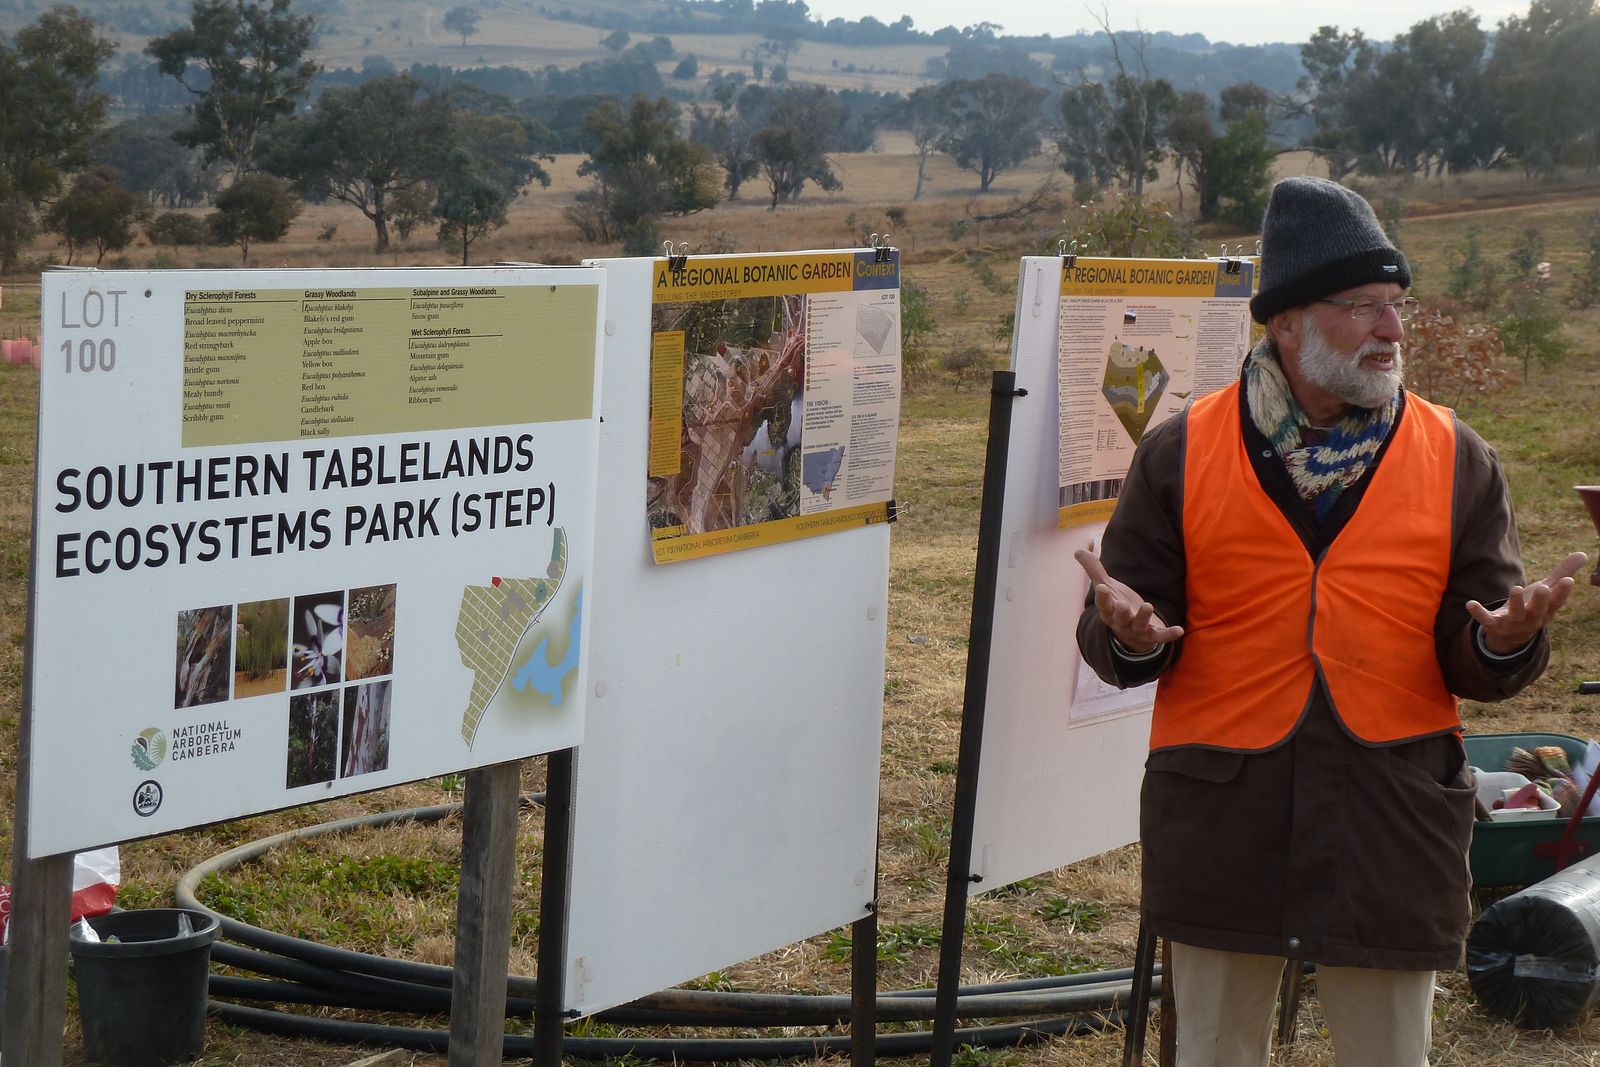
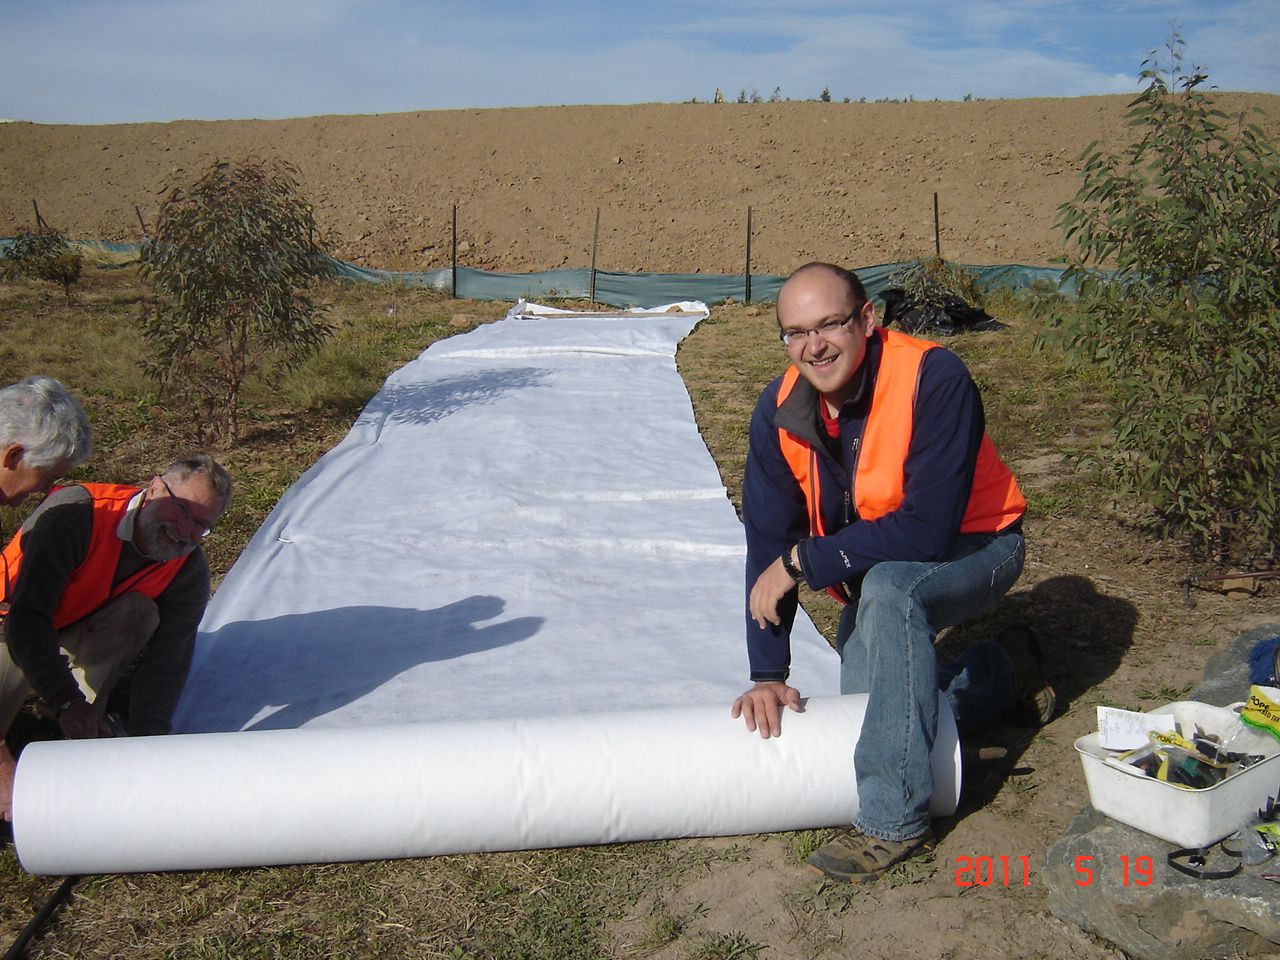
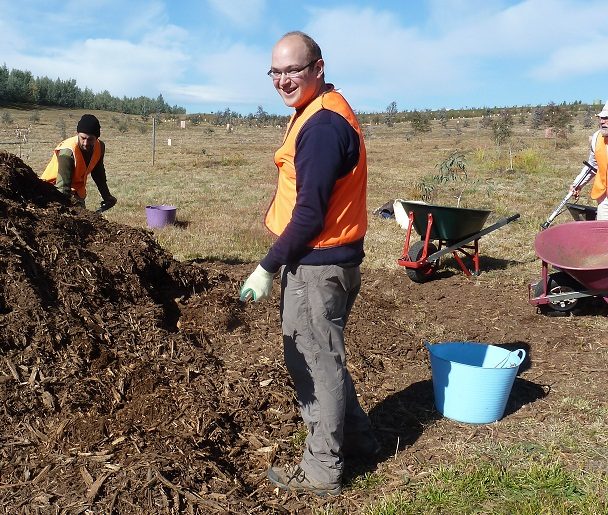
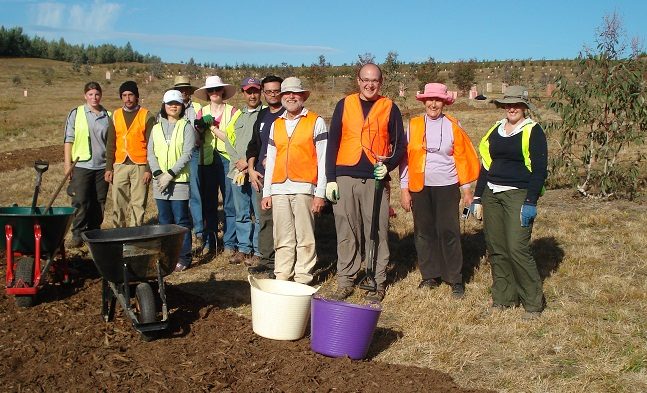
"STEP has become part of my home away from home, a community, an extended family. It has given me a sense of place. I thought it was hard to step off the Murray's bus in Canberra, but it will be even harder to step back on."Lee Pearson, article for STEP, August 2011
Who built on the work
Papers and reports that cite the Aisbett and Pearson working paper or use Lee's SPS dataset, newest first. Each entry links to the source.
Conferences and seminars
The PhD was argued in rooms around the world: trade economists in Tokyo and Leuven, econometricians and statisticians in Famagusta, plant pathologists in Providence, sustainability researchers in Cambridge and Marrakesh, and the WTO's own staff in Geneva. Co-author Emma Aisbett took the joint paper on to Kiel, Melbourne and Banff. In 2014 Lee also took the coffee risk work that grew out of it to the International Coffee Organization's annual meeting in London. Tap a country to see what was presented there, and the conferences Lee attended.
Talks from the thesis's list of presentations (section 1.4), Lee's Fulbright reports and the dated slide decks and posters, 2011 to 2014 (Emma Aisbett's decks for Kiel, Melbourne and Banff). Conferences Lee attended without presenting are marked "attended" and come from delegate lists, registrations, his notes, travel bookings and his EPA Marshall Scholarship expense claims. Map: Natural Earth 1:110m, public domain.
Teaching alongside the research
Lee taught at Imperial through the PhD. In his first term, in January and February 2011, he led tutorials and demonstrated a fisheries modelling practical in Prof. John Mumford's Resource Management class at the Centre for Environmental Policy.
Trade and environment, with a trading game
For the Centre for Environmental Policy's MSc students, Lee taught two three-hour classes each spring: on 4 and 5 March 2013, and on 5 and 7 March 2014. The first, "Trade, Development, and the Environment", gave an hour to ActionAid's International Trade Game, with the class split into six country teams and one volunteer as the Trader. The second, "SPS Agreement and Biosecurity Protection(ism)", took the students through Lee's own research on SPS notifications and trade concerns, and through virtual water and water footprints, the subject of his Edinburgh dissertation.
Teaching assistant in managerial economics
In the autumn term of 2012 Lee taught the weekly classes of Managerial Economics (BS0815) for Professor Richard Green: 160 students in two classes. He wrote his own answer slides for all nine classes and ran the review session before the exam in January 2013.
Sources: Lee's Trade and Environment class slides of 4 and 5 March 2013 and 5 and 7 March 2014, and his reading guidance for the class; the BS0815 course outline and class exercises for 2012-13, and Lee's class and review-session slides; Lee's CV of January 2013 (160 students); Lee's EPA Marshall Scholarship claims, January and February 2011 (the Resource Management tutorials).
From a thesis to a risk model in farmers' hands, and on to building ventures
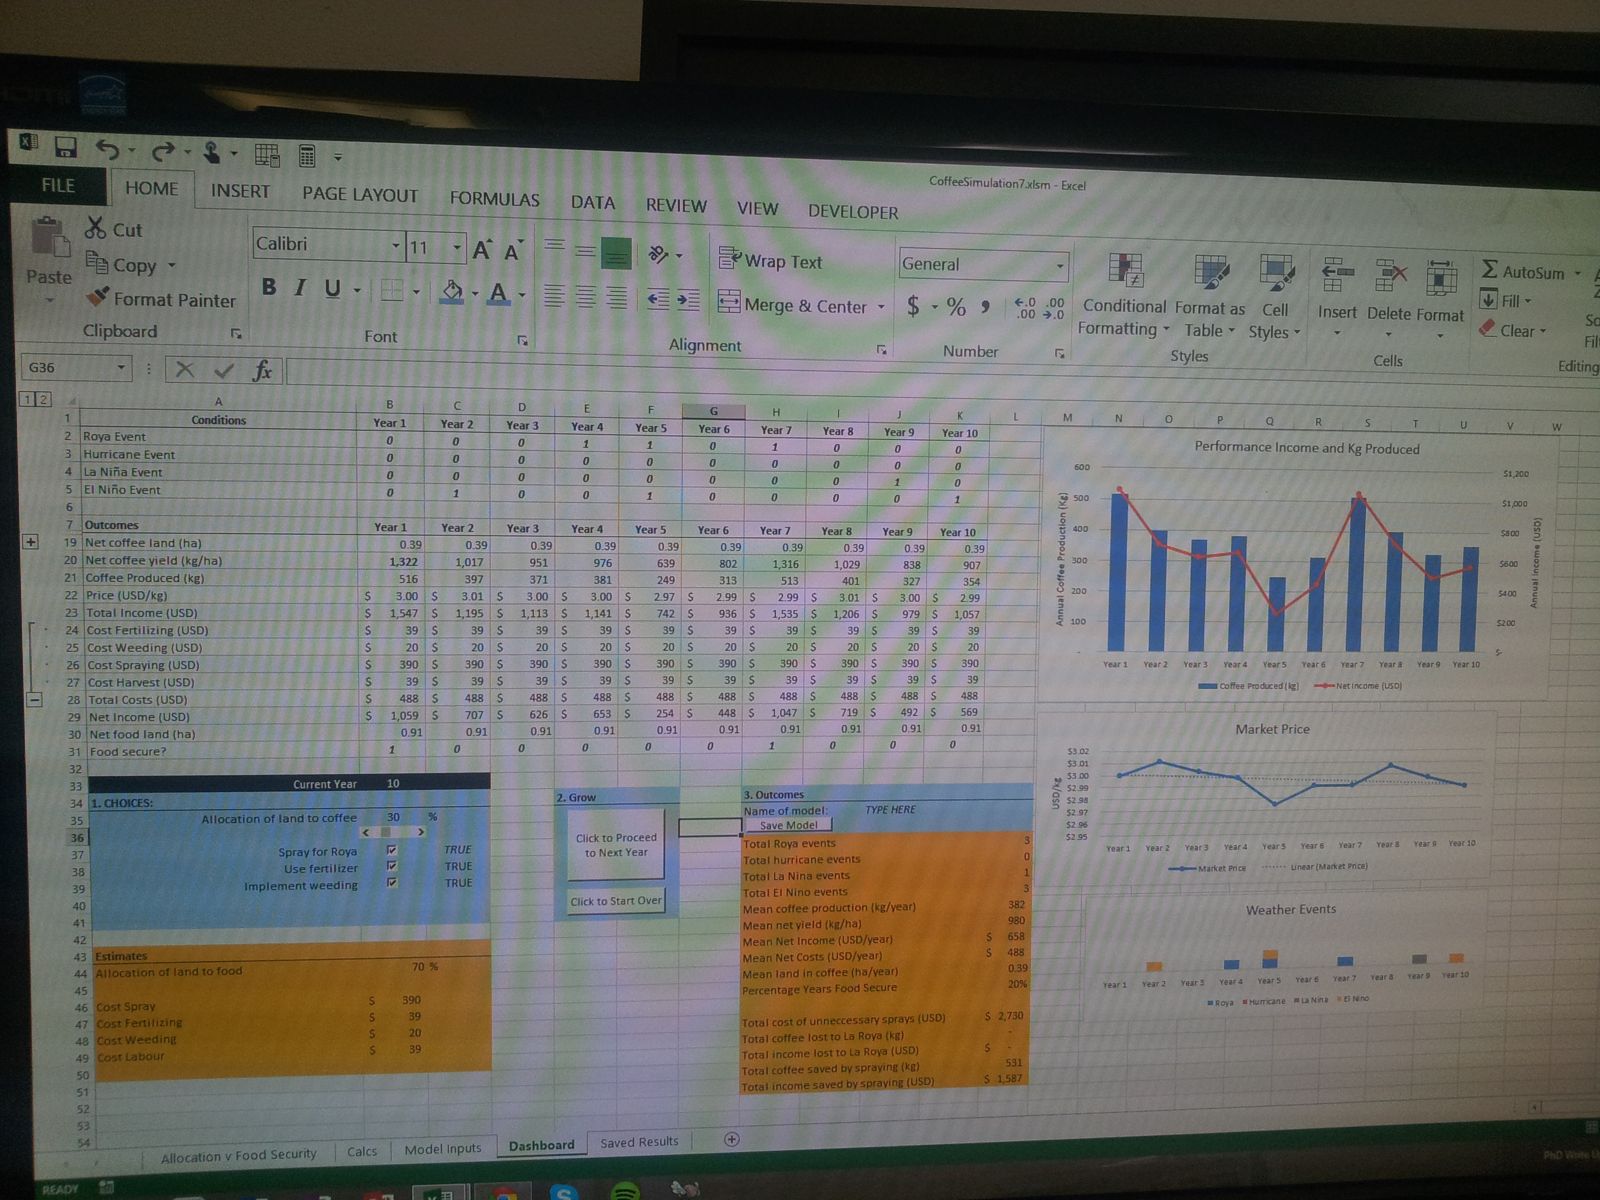
The PhD asked who carries the risk in food trade, and found it sits with the growers least able to carry it. In 2014 Lee put that finding to work: a coffee risk simulator for smallholders in Central America, built with CABI and the Hanns R. Neumann Stiftung, field-tested in Guatemala and Honduras in November and handed over in Hamburg that December. The same habit, putting numbers on risk so someone can act on it, runs through everything Lee built afterwards.
Peter Baker, CABI
Peter Baker is a coffee scientist at CABI, the international agricultural research organisation, and led the 2012 Coffee & Climate diagnostic in Trifinio with farmers, extension agents and the science. They met after Lee's Imperial seminar on the Uganda coffee survey, and in March 2014 Lee wrote to offer help. Peter's reply set the brief: turn farmer records into costs, yields and incomes, then add drought, rust and berry borer scenarios. An Imperial Charity Insights placement then took Lee to CABI in Egham for four weeks from late August.
Hanns R. Neumann Stiftung (HRNS)
HRNS is the Hamburg foundation of the Neumann Kaffee Gruppe, the coffee trader, and works with smallholder coffee families in Latin America, Africa and Asia. Its Coffee & Climate team, with Pablo Ruiz in Guatemala, shared the Trifinio field books, ran the November field week with its extension agents and received the finished simulator in Hamburg on 17 December 2014.
"Lee's modelling approach, which is simple enough for people to play with themselves, has already caused a lot of reflection within HRNS."Peter Baker, CABI, October 2014
Peter wrote that while introducing Lee to Joann de Zegher, then a Stanford PhD student modelling how climate change could unsettle where roasters source their coffee. The two traded notes on her draft that October. Joann went on to research sourcing from smallholders at MIT Sloan and founded PemPem, a trading platform that pays Indonesian palm oil smallholders on time and traces their fruit for mills and buyers.
Five harvests in the Trifinio field books
Peter Baker's first ask, in March 2014, was to turn farmer records into the costs, yields and incomes a risk model needs. Pablo Ruiz of the Hanns R. Neumann Stiftung (HRNS) sent the Coffee & Climate field books from Trifinio, the highlands where Guatemala, Honduras and El Salvador meet: 412 farm records across the 2008/09 to 2012/13 harvests. Pick a country.
Median coffee cherry per hectare
Farms that lost money that harvest
Source: Hanns R. Neumann Stiftung farmer field books for Trifinio, shared with Lee in March 2014. Medians and shares computed for this page, with no farmer names shown. Harvest years start in the year shown, so 2012 means 2012/13. A farm counts as losing money when its recorded costs exceeded its coffee income.
November 2014: testing the simulator in the field
Ask the people who advise farmers
The 2012/13 rust year had shown how exposed farmers were to shocks. The trip was built to validate the simulator with HRNS extension agents and farmers: which risk numbers a farmer could actually act on, a typology of farmers (households that receive remittances, for example, can ride out a bad year differently), and field-checked costs, yields and shock odds to feed back into the model.
The week ran one-to-one interviews with extension agents, visits to large and small farms, and a closing group session where Lee presented the corrected parameters and outputs.
Climate is already hitting the farm
Peter Baker's 2012 Trifinio diagnostic cross-checked farmers, extension agents and the science. All eight PROTCAFES technicians he met said climate change was already affecting coffee, and rated storms, irregular rain and drought highest; rust was the disease they feared most. In 2012/13 the "Big Rust" swept Central America, and a national workshop in Guatemala put the country's production loss to rust at 15%.
The simulator went to the HRNS team in Hamburg in December 2014.
A 27-year coffee cash flow, run thousands of times
A Monte Carlo simulation of a coffee plot with coffee rust (roya), climate shocks and price swings. It answered questions such as how large a plot must be for a 75% chance of meeting a minimum income, and how often a heavy rust year can hit before the plot stops paying.
"Beyond an expected heavy roya event in 10 out of 100 years, the coffee plot project becomes tenuous."
Who will lend against the risk?
The field week also found that about 35% of farmers in one area could not get any credit, and that a 12-month loan cost 18% a year. Lee proposed the model as a way to size coffee renovation loans: a risk number a lender can underwrite. That question, how to turn a farm's risk into something finance can carry, is where the next ten years started.
Back in London: the November 2014 seminar
Five days after the field week, on 12 November 2014, Lee presented the simulator at "Messages from the field: uncertain development outcomes from agriculture", a lunchtime seminar at Imperial's Centre for Environmental Policy. Carol Ellison of CABI opened with "Tales of the Unexpected", a talk she wrote with her CABI colleague Peter Baker; both are senior scientists there. It set out trends that worry field scientists, from a coffee rust outbreak in Latin America and coffee wilt spreading in Africa to the collapse of the jatropha "miracle", which they argued good science and strong institutions could have prevented. On climate change and development, they said, "we are not dealing with risk, we are dealing with uncertainty", and scenarios, simulations and many small trials can help. Jennifer Baka of the London School of Economics presented her study of India's jatropha policy and the "wastelands" it was meant to use. Lee's talk was "Simulation tool development for coffee extension agents in Central America".
Three questions, tested in the field
What is a coffee plot worth when weather and prices are uncertain? How can extension agents tailor their advice to each plot and farmer? And how can the risk of different ways of farming best be shown to farmers?
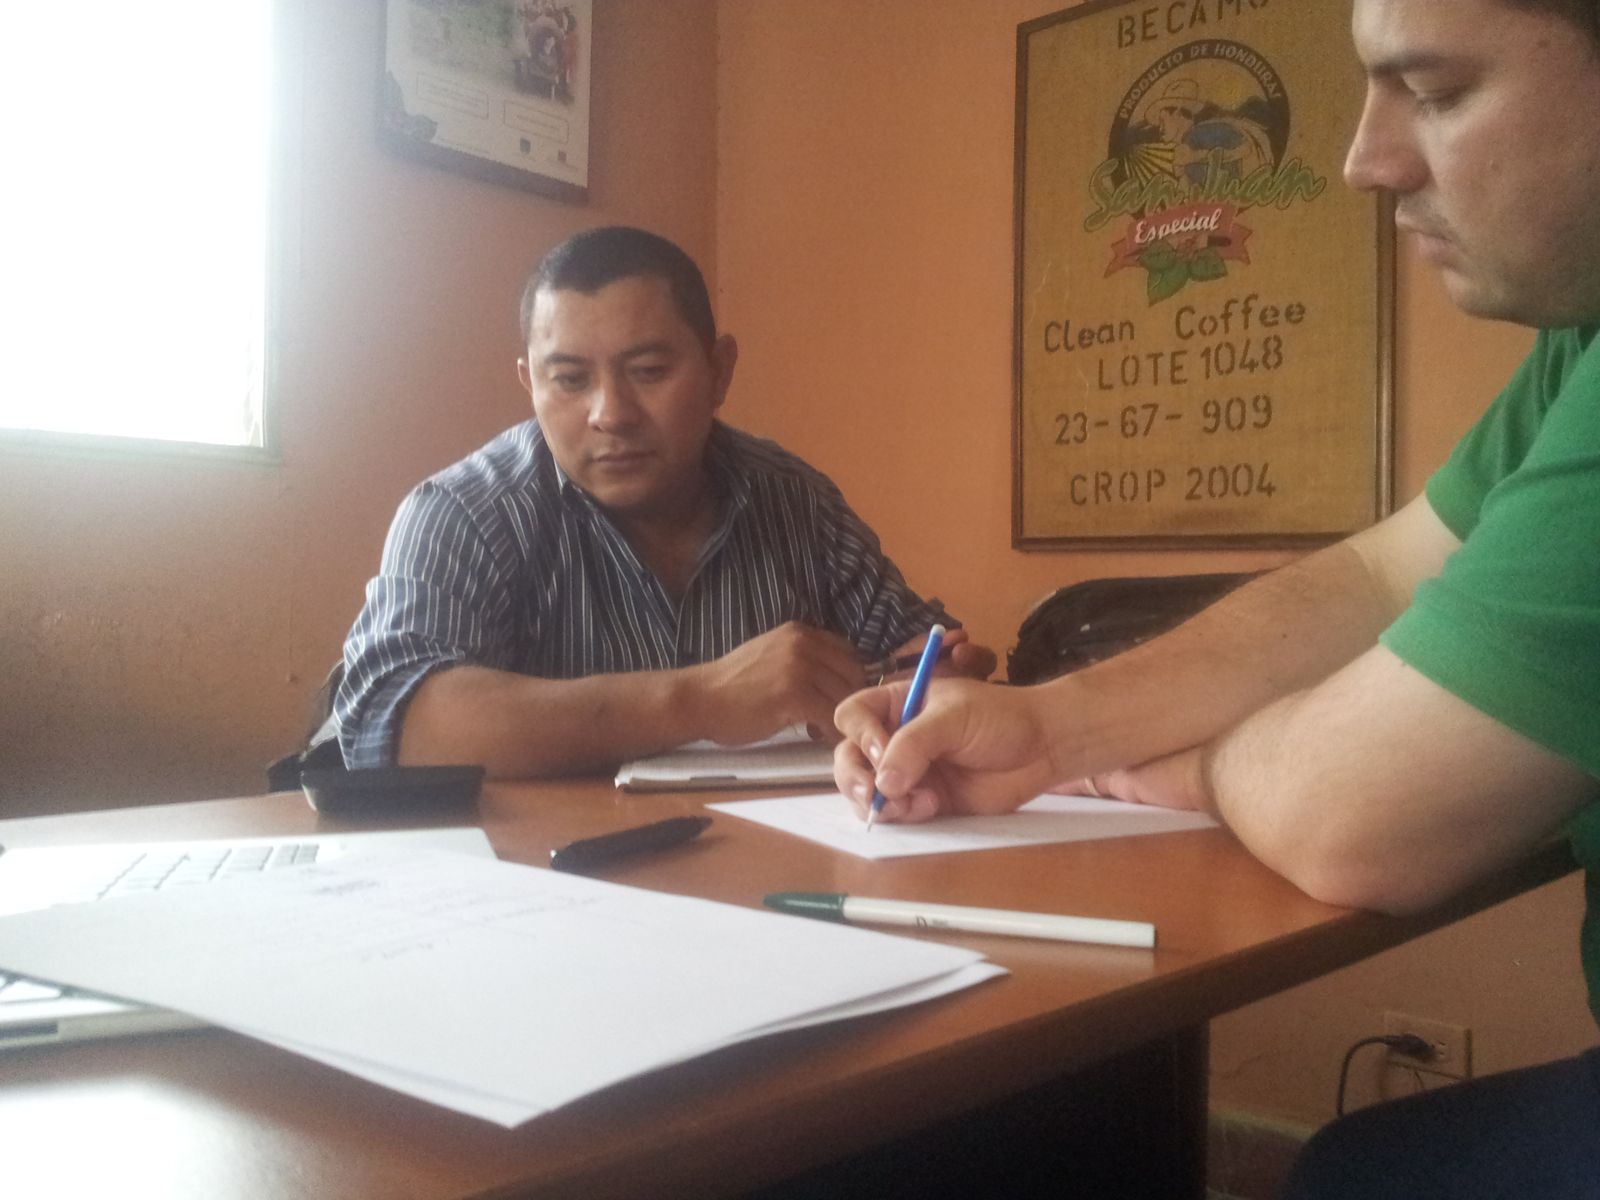
In the field week Lee put the simulator to a regional director of ANACAFE, Guatemala's national coffee association, and to a cooperative leader, a technician and a small farmer in Honduras: checking the cash-flow numbers, asking whether and how they would use the tool, and trying out ways to show risk. His answer to the last question was to count farmers, not percentages. See it in the simulator.
The talk also argued for comparing farms per bag of coffee, not per hectare: high inputs look costly on the farm but can mean low costs per bag.
Topics for the next MSc class
The talk ended with work Lee hoped Imperial's MSc students would take on for their theses: testing the new estimates against the HRNS field books, microfinance and micro-insurance for small coffee plots, climate model forecasts for the weather risks, and the effect of drought on HRNS coffee growers in Brazil.
Two of the previous year's MSc students had presented at the International Coffee Organization's annual meeting in London. Lee spoke there on 26 September 2014, sharing a Coffee & Climate session with Peter Baker of CABI, on the risks to a coffee farm's income and costs, and ending with a live run of the simulator.
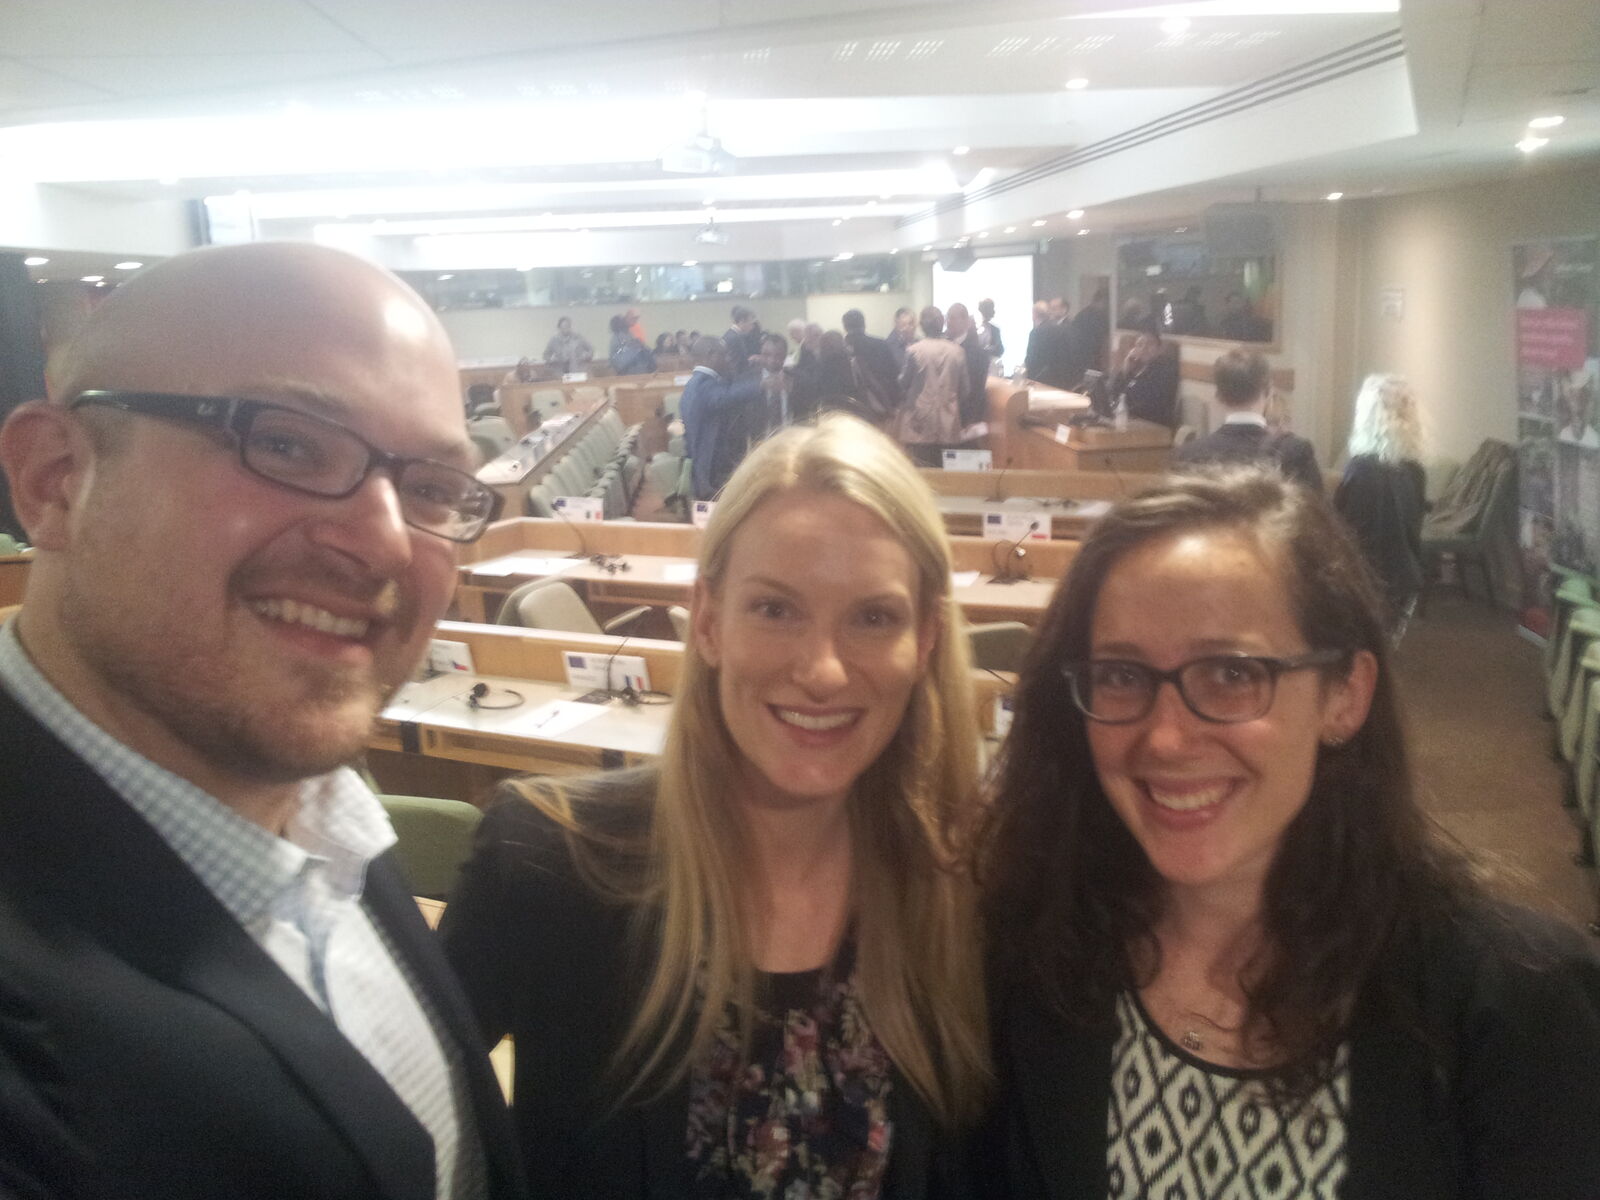
Source: the three slide decks from the 12 November 2014 seminar (Lee Pearson; Carol Ellison and Peter Baker, CABI; Jennifer Baka, LSE) and Lee's ICO deck "Modelling Risks of Coffee" (23 September 2014), the September 2014 ICO emails with Peter Baker, and Lee's phone photo from the day.
The bridge: from the PhD to Wovoka
Each step after the PhD took the same idea further: measure the risk, then design the venture, contract or finance that moves it to someone who can carry it.
- 2015 to 2020
BCG and BCG Digital Ventures
Lee joined Boston Consulting Group straight from the PhD and rose from Consultant to Principal, then joined the founding team of BCG Digital Ventures' energy practice. Lee partnered with a global gas company on a small-scale LNG venture that led to an $80M+ investment in a new business unit.
From the PhD: the cash-flow and risk models became business cases for new ventures.
- 2017
Launching Setel in Malaysia
As BCG's business lead on the build, Lee managed the team in a 14-week sprint with Petronas, Malaysia's national energy company. The sprint put Setel, a mobile app for paying for fuel and more, into the market in Malaysia, where more than nine million people now use it.
From the PhD: start from the person at the pump, as the field work started from the grower.
- 2020 to 2022
SE Ventures, Schneider Electric
At Schneider Electric's venture fund in Palo Alto, which now manages €1 billion, Lee was the sustainability and carbon lead on the investment committee.
From the PhD: pricing environmental risk into an investment decision.
- 2022 to 2023
Atrium Energy, Johnson Controls
As an entrepreneur in residence at Johnson Controls, Lee won executive approval to invest in and launch a spin-out, Atrium Energy, to bring energy savings and climate benefits to mid-market buildings.
From the PhD: the Cambridge question again, how to make saving a resource pay the person who does the work.
- 2022 to now
Wovoka
Lee co-founded Wovoka and runs it from Manila: a nature-based solutions developer that works with landowners and communities, with a team in the Philippines. Its models of a landowner's income are direct descendants of the coffee plot cash flow on this page.
From the PhD: measure the risk where the farmer stands, then build the contract and finance around it.
Run the coffee risk simulator
This is Lee's December 2014 risk simulator, ported line by line from the Excel workbook handed over in Hamburg. It follows one hectare of coffee in Ocotepeque, Honduras, from planting through 27 years of harvests, stumping and replanting, at 2014 costs and prices, and runs it hundreds of times with coffee rust (roya), climate shocks and price swings drawn at random. Move the risks and see which way of farming still pays.
Good agricultural practices (the HRNS recommendations) cost more each year in fertiliser, lime, organic matter, soil tests and labour, and raise the yield ceiling from 30 to 55.6 quintals of parchment a hectare. Selling half as parchment means processing it yourself for a better price.
Net present value of the hectare over 25 years
The dot is the median future; the bar runs from the 25th to the 75th percentile. Discounted at 10% a year, in 2014 US dollars.
Twenty farmers on the same plan
In the November 2014 field week Lee also tested how to show this risk to farmers. The answer he took to London was to count farmers, not percentages, an idea from Gerd Gigerenzer's book Risk Savvy. His slide read: "We expect out of 20 farmers following this plan: 3 will make over 20,000 Q/year, 12 will make between 10,000 and 20,000 Q/year, 5 will make less than 10,000 Q/year" (Q is the Guatemalan quetzal). Here is the same kind of count for the four ways of farming, from the futures above. The slide sorted farmers by income per year; here each future is sorted by what the plan earns over 25 years, compared with what it is worth on paper, with no rust, shocks or price swings.
How much rust can a plot take?
Median NPV for each way of farming as heavy rust years become more common, with the other risks as set above. Lee's finding in 2014: beyond an expected heavy roya event in about 10 out of 100 years, the plot becomes tenuous.
One possible future
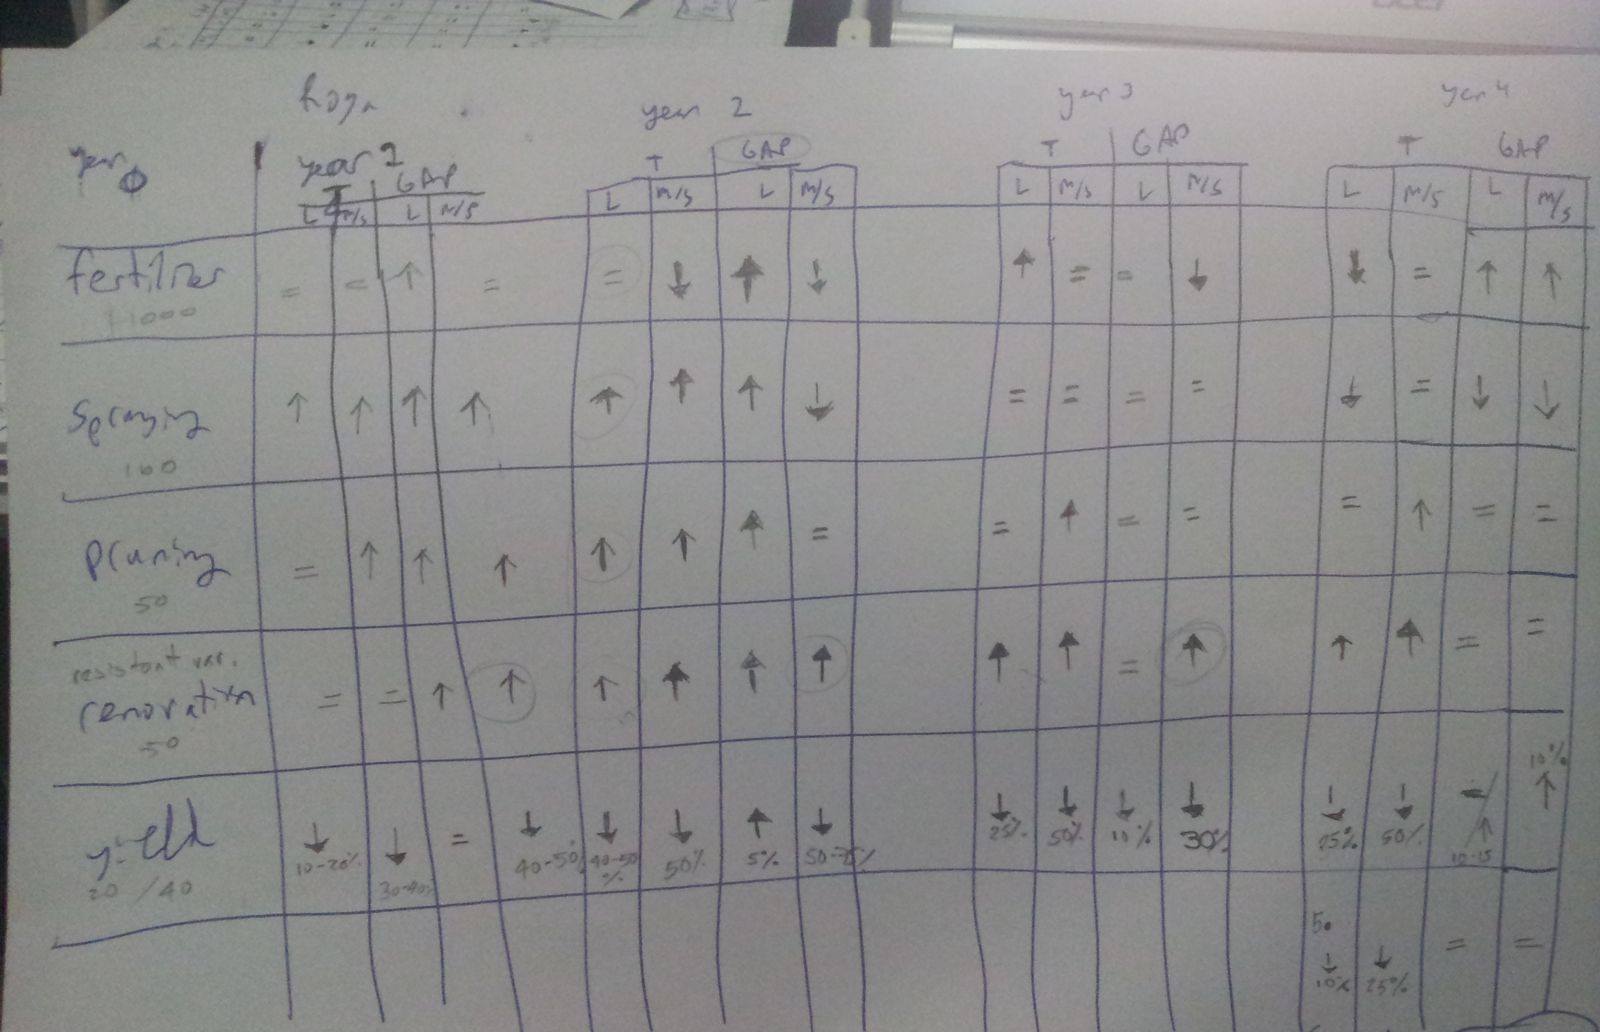
Filled in by hand, one extension agent at a time
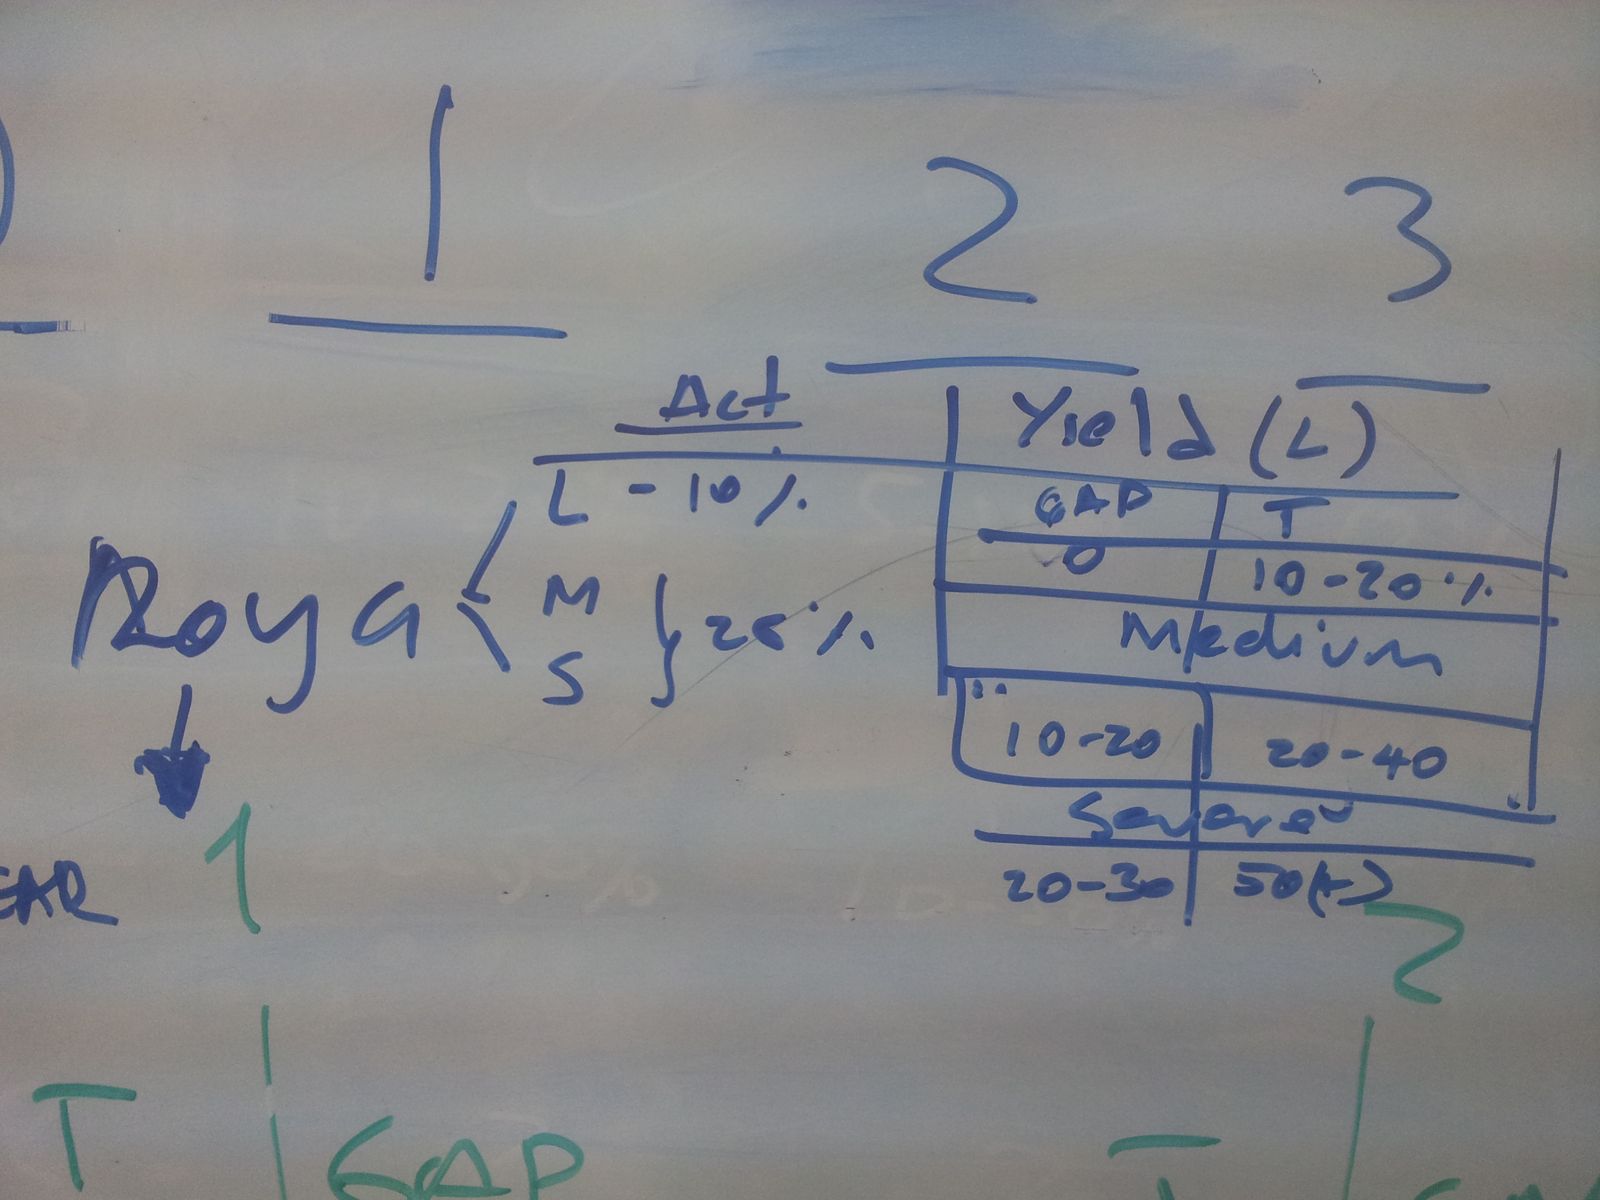
During the November 2014 field week, each extension agent marked how a farm's fertiliser, spraying, pruning, renovation and yield move in each of the four years after a light or a severe rust outbreak, for traditional and good-practice farms. Grids like this one fed the rust table that this simulator still uses.
A 27-year cash flow, line by line
Each year the model works out yield from tree age, the big-crop and small-crop swing, stumping, soil, slope and shade, then subtracts labour (planting, weeding, fertilising, pruning, spraying, stumping, harvest) and inputs (fertiliser, fungicide, seedlings, bags, transport). A rust outbreak cuts yield for up to five years and raises spraying and pruning costs; a climate shock cuts one harvest. Prices follow a random walk around the 2014 farm-gate and parchment prices.
Ported line by line from the Excel file
With every risk switched off, the four ways of farming are worth 1a $1,907, 1b $2,569, 2a $2,072 and 2b $3,425 a hectare. It keeps the workbook's own choices too, such as counting NPV over years 0 to 24 and leaving out the first two start-up years when counting good years. One slip is corrected: for the good-practice scenarios, the workbook compared yearly income with the wrong cell when counting years above the minimum income. The defaults are the example in Lee's December 2014 guide: light rust in 10 and heavy rust in 5 of every 100 years.
Source: Lee Pearson, HRNS Risk Simulator for Central America (Excel, December 2014), Risk Simulator Guide (17 December 2014), field report (November 2014) and his slides for the Centre for Environmental Policy seminar of 12 November 2014 (the count out of 20 farmers), built for CABI and the Hanns R. Neumann Stiftung's Coffee & Climate initiative. Costs and yields are HRNS's 2014 Ocotepeque cash-flow assumptions for one hectare, not advice for any farm.